


Received 12 May 2023; Revised 13 August 2023; Accepted 29 August 2023.
This is an open access paper under the CC BY license (https://creativecommons.org/licenses/by/4.0/legalcode).
Magdalena Zioło, Professor, Faculty of Economics and Management, University of Szczecin, Mickiewicza 64, 71-101 Szczecin, Poland, e-mail: This email address is being protected from spambots. You need JavaScript enabled to view it. 
Elżbieta Szaruga, Assistant Professor, Institute of Management, University of Szczecin, Cukrowa 8, 71-004 Szczecin, Poland, e-mail: This email address is being protected from spambots. You need JavaScript enabled to view it.
Anna Spoz, Assistant Professor, Institute of Economics and Finance, The John Paul II Catholic University of Lublin, Aleje Racławickie 14, 20-950 Lublin, Poland, e-mail This email address is being protected from spambots. You need JavaScript enabled to view it.
Abstract
PURPOSE: The influence of environmental, social, and governance (ESG) factors on financial performance has been confirmed in the literature. The article aims to examine the relationship between financial and non-financial factors in enterprises and to indicate for which groups of enterprises the relationship of ESG and financial performance is most visible in the context of building sustainable business models and the ability to adapt to sustainability. The article assumes that enterprises’ financial and non-financial results determine their adaptability to sustainability, and there is a relationship between financial results, non-financial performance, and companies’ sustainable business models. METHODOLOGY: The analysis encompasses 11 EU countries in the period 2008–2020. The study analyzed 6,864 observations, that is, 96,096 data cells. The data are divided into two groups of variables: financial and non-financial. The research is based on clusters analysis and ANOVA. It was carried out in two stages. In the first step, enterprises were grouped into clusters according to the financial condition criterion, considering the enterprise’s size and sector and country in which it operates. In the next step, it was checked whether enterprises with good financial standing also achieve better non-financial results. FINDINGS: It was found that large enterprises achieve better financial results than small and medium-sized enterprises, even though they operate in the same location and sectors. It can be emphasized there are statistical differences between entities with relatively good financial conditions and those with relatively weaker financial conditions in the context of such values as gender employment gap, total population living in households considering that they suffer from noise, greenhouse gas emission, Corruption Perceptions Index. The companies with relatively better financial standing achieve a smaller gender employment gap (at the national level) than entities with relatively worse financial conditions. It is similar to referring to the greenhouse gas (GHG) level. IMPLICATIONS: The results of this study may be useful for managements of companies in developing strategies of transformation towards sustainability, thanks to the fact that they provide information on what factors should be taken into account in the transformation process. ORIGINALITY AND VALUE: The originality of this study lies in the fact that it takes into account both financial and non-financial factors and examines the relationships between these factors in the process of companies’ adaptation towards sustainability and sustainable business model.
Keywords: sustainable business models, ESG, financial performance, risk, sustainability, adaptation, companies, financial factors, non-financial factors
INTRODUCTION
The environmental, social, and governance (ESG) risk, and counteracting its effects require adjustment processes that are a challenge for all market participants. The risk of non-financial factors is among the top five in impact strength (Global Risks Report, 2021; KPMG, 2021) and is a global challenge for governments, enterprises, households, and financial markets. The relationship between ESG factors and financial performance is documented and well recognized in the literature (Friede et al., 2015; De Lucia et al., 2020). The impact of ESG on the financial situation of enterprises (but not only) is one of the factors determining the necessity to undertake adaptive actions and change their business models towards sustainable business models. The second important factor determining the transition is the regulations introduced at the national and international level. The European Union, which remains the leader in terms of regulations (176 reported for Europe in 2020, Drei et al., 2019) supporting the implementation of the concept of climate neutrality, has adopted several legal solutions in this area.
The relationship between ESG and financial performance has been analyzed in many contexts for various sectors and types of enterprises (Velte, 2017). There is a lack of in-depth analyses considering typological groups of enterprises and research showing how enterprises from different groups adapt to sustainability. The article fills this gap and attempts to classify enterprises considering financial and non-financial variables, and then examines the specificity of the behavior of these enterprises relating to their adaptation and adjustment activities.
The article aims to investigate whether the financial results of enterprises determine their adaptability to sustainability and whether there is a relationship between financial results and non-financial performance. The main research questions (RQs) are:
RQ1) Is there a relationship between companies’ financial condition and their
non-financial performance?
RQ2) How do sector, size, country, and financial results matter for companies’
ability to adapt to sustainability?
The paper is organized as follows: the introduction in Section 1; Section 2 presents the literature review. In Section 3, the methodological approach, data collection procedure, and description of methods are described. Section 4 discusses the research results, and Section 5 is the conclusion.
LITERATURE REVIEW
The growing interest in the issue of business models among scientists began in the mid-1990s and was related to the dotcom boom. Along with the development of research in this area, new definitions of this concept were created, presenting alternative approaches. Knyphausen-Aufsess and Meinhardt (2002) and Magretta (2002) perceived the business model as a simplified organizational system, the scheme of the functioning of the enterprise. Casadesus-Masanell and Ricart (2010), Massa et al. (2017), and Richardson (2008) drew attention to the relationship between the business model and the company’s operating strategy and the achievement of its goals. The latter also emphasizes the role of the business model in creating, delivering and capturing value. A similar approach was presented by Osterwalder and Pigneur (2010), who defined the business model as “the rationale of how an organization creates, delivers, and captures value.” Magretta (2002) additionally highlights for whom this value is created and how the value can be delivered at the appropriate cost. The relationship between the value created for the customer and the structure of the company’s costs and revenues can also be found in the description of the business model proposed by Teece (2010). Creating value requires an appropriate configuration of the company’s resources and technological potential (Chesbrough & Rosenbloom, 2002) and appropriate cooperation with its partners (Zott & Amit, 2010). Business models can contribute to the construction of the techno-economic network of innovation (Doganova & Eyquem-Renault, 2009,) as well as they can be a way to achieve and maintain a competitive advantage (Wirtz et al., 2016).
Scientists and managers are increasingly using business models not only to create economic but also social and environmental value (Dohrmann et al., 2015). The inclusion of ESG factors in the business model means its transformation towards a sustainable business model (SBM). Lüdeke-Freund et al. (2016) note that compared to traditional, sustainable business models expand the possibilities of developing innovative solutions in the field of environmental and social issues that may be a source of competitive advantage for an enterprise (Porter & Kramer, 2011). They also broaden the concept of value with non-financial values, i.e., social and environmental ones (Bocken et al., 2014), and offer a broader perspective of value creation at the system level – they extend the current perspective focused on customers and shareholders with new groups of stakeholders. Yang et al. (2017) and Goni et al. (2021) perceived the innovation of the SBM model in the expansion of the relationship with stakeholders and the change in this relationship. This relationship should be viewed and shaped in a broad and long-term perspective, enabling them to be mutually beneficial and lasting relationships with key internal and external stakeholders based on trust (Gulati & Kletter, 2005; Evans et al., 2017). As defined by Bocken et al. (2013) “sustainable business models seek to go beyond delivering economic value and include a consideration of other forms of value for a broader range of stakeholders.”
Sustainable business models can be created by combining business model patterns (Abdelkafi et al., 2023). Based on a literature review, Ferreira et al. (2021) distinguished five areas of SBM-related issues addressed in scientific publications: SBM implementation, SBM challenges, institutional SBM, circular SBM, and emerging SBM. Mignon and Bankel (2023) point out that companies often struggle to identify, develop and implement sustainable business models that suit them. In the literature on the subject, more and more studies are devoted to patterns of sustainable business models (Schroedel, 2023; Ferreira et al., 2021; Shakeel et al., 2020; Lüdeke-Freund et al., 2018, Bocken 2014).
The transformation of the business model towards a sustainable business model requires adaptation measures. Sustainable adaptation is about redesigning a company’s business activities (on a strategic and operational level) in such a way that it is able to create sustainable value for a wide range of stakeholders. Alkaya et al. (2015) emphasize that creating a sustainable business model requires a system of sustainable value flows among multiple stakeholders, including the natural environment and society as primary stakeholder.
In the literature on the subject, two research directions can be distinguished on the adaptation process towards sustainable business models. The first relates to changes introduced to the already existing business models, i.e., adaptation to the new conditions of the company’s operation. As a rule, it is a process of adapting the way a company operates, to changes in its environment (and thus triggered by external factors) (Teece, 2010; Demil & Lecocq, 2010). The second direction results from the need to create innovative solutions by implementing an innovative business model (Aspara et al., 2010; Casadesus-Masanell & Zhu, 2013). In this context, changing the business model enables an innovative approach to the problem (including ESG factors in decision-making processes) and is a way to gain a competitive advantage. “At root, business model innovation refers to the search for new logics of the firm and new ways to create and capture value for its stakeholders” (Aspara et al., 2010).
Many factors influence the company’s decision to change its business model to a sustainable one. They may result from the need to adapt to a “new” perception of business or be driven by factors such as the personal values of entrepreneurs and their attitude to change (Rauter et al., 2017). Independent studies by Stoughton and Ludema (2012) and Rauter et al. (2013) show that the organizational culture of the company and the commitment of the leaders and the entire staff determine the possibility of successfully completing the transformation process towards sustainable development. External factors may include legal regulations (Lozano, 2015), pressure from stakeholders (Thorisdottir & Johannsdottir, 2019; Lozano, 2015; Wolf, 2014), and technological innovations (Cheah et al., 2018; Rantala et al., 2018; Evans et al., 2017).
Lüdeke-Freund et al. (2016) point out that each adaptation process towards a sustainable business model is an individual process. Depending on the size of the company, the industry in which it operates and its individual needs, adaptation activities may include: creating a sustainable product offer (Reeves et al., 2012; Joyce & Paquin, 2016), using energy-saving/green technologies (Oghazi & Mostaghel, 2018; Chasin et al., 2020), reducing water consumption (Jamaludin & Yusof, 2013; Bocken et al., 2018), supporting charity campaigns/supporting local community (Zufall et al., 2020; Ball & Lunt, 2020), and applying employee friendly policies (Joyce & Paquin, 2016; Minoja & Romano, 2021). The transformation of the business model towards a sustainable business model requires financial outlays, but its implementation may result in an increase in revenues, e.g., as a result of increasing sales, expanding the group of customers, etc. Despite the growing number of publications in the field of SBM, there is no research on what factors determine the adaptability of enterprises and what is the significance of financial factors in the adaptation process, and whether there is a relationship between financial and non-financial results and sustainable business models of enterprises.
METHODOLOGY
The paper uses several statistical methods, spatial data exploration, and data mining techniques, including ANOVA (Huang, 1998), k-means (standardized by Euclidean distance) (Grandoni et al., 2022), Kruskal-Wallis test (Ruxton & Beauchamp, 2008), the Wilks multivariate significance test (Liu et al., 2011), Mann-Whitney U test (Rosner & Grove, 1999), Bonferroni test (Armstrong, 2014), Scheffé tests (Brown, 2005), Dunnett’s test (Brown, 2005), and selected descriptive statistics.
The research procedure was carried out in 7 steps (Figure 1).
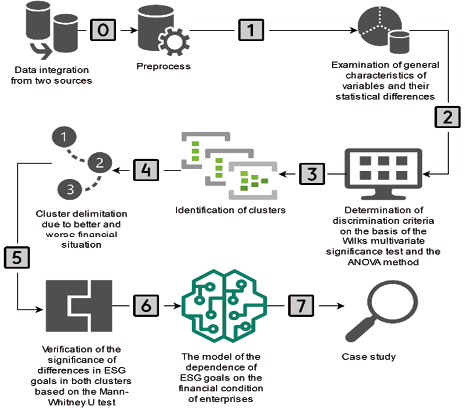
Figure 1. The framework of the authors’ research procedure (methodology)
- In stage 1, the general characteristics of the examined financial and non-financial variables and their statistical differences were analyzed using the Kruskal-Wallis test for financial variables from the national perspective (country as a grouping variable).
The Kruskal-Wallis test formula used in step 1 can be written as follows (Hoffman, 2019):
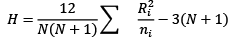
where N is the total number; ni is the number in the i-th group, Ri is the total sum of ranks in the i-th group. All data are ordered in ascending order from lowest to highest. Then they are ranked, summed for each subgroup, and the probability is calculated. Furthermore, the value of H is tested against the chi-square distribution for k-1 degrees of freedom (k is the number of groups). In the case of ties, a correction (introducing a small difference) is applied. If the Kruskal-Wallis test takes into account only two groups for the grouping variable, it would reflect the Mann-Whitney U test.
- In stage 2, the ANOVA method and the Wilks multivariate significance test were used to investigate whether the country, sector, and size of the enterprise (latent variables expressed on a nominal scale) differentiate financial characteristics. At this stage, the criteria for cluster discrimination necessary for stage 3 were identified.
In the second stage, the Wilks lambda (λ) statistic (Marcoulides and Hershberger, 2014) and the F statistic can be written (Richardson, 2011):
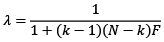
where SS (between groups) is the sum of the squares of the effect for the independent variable, SS total is the total of the sum of squares, 1 − k and N − k are the degrees of freedom (df), N is the number of total observations, and k is the number of groups.
- In stage 3, the k-means method was used to determine clusters. This stage was validated using V-fold cross-validation. However, the cost sequence graph was used to determine the optimal number of clusters.
The Euclidean distance can be represented by the formula (Suchecki & Lewandowska-Gwarda, 2010):

where xik, xjk are the normalized values of the k-th variable for the objects oi and oj; d(oi, oj) is the distance between the two objects to be analyzed.
- In stage 4, the clusters of better and worse financial conditions were delimited to each other based on normalized means. It was also assumed that the cluster number is a hidden variable related to a relatively better or worse financial condition.
- Subsequently, in stage 5, the Mann-Whitney U test (with continuity correction) was used to test whether clusters significantly differentiate ESG indicators (non-financial data at the national level). On its basis, non-financial indicators were identified, which are statistically different due to the cluster (with the relatively better and worse financial condition). In this step, it was legitimate to compare non-financial indicators between the two designated clusters (with the better and worse financial condition).
The statistics of the Mann-Whitney U test were used (Corder & Foreman, 2014):

where Ui is the test statistics for the full sample; ni is a number of values from the full sample; n1 is a number from the first sample; n2 is a number from the second sample;  Ri is the sum of the ranks from the full sample.
- Then (in stage 6), a model of the dependence of ESG goals (non-financial variables - statistically significant in the previous stage) on the financial condition of enterprises was built (the cluster is a hidden variable). The Bonferroni and Scheffé tests were used when the samples had few but equal variances, and Dunnett’s test was used when the samples were few and unequal.
- The last step (stage 7) concerns the example of large companies in the transport and storage sector (a case study). In it, a dedicated ANOVA model was built and the dependence on financial conditions of large companies in the transport and storage sector for sustainable development (partial eta-squared) was verified.
The results from the previous stage determined the criteria for selecting the method and variables in the next stage. The list and definitions of all variables are presented in Table 1.
Table 1. Definitions of variables
|
Variable name |
Variable definition |
Variable calculation |
|
|
Financial variables |
|||
|
Financial variables |
|||
|
1 |
Total assets |
Total amount of assets owned by an entity |
- |
|
2 |
Net turnover |
Includes sales of goods and services net of returns, deductions and rebates. Sales are net of VAT and Excise taxes |
- |
|
3 |
EBIT |
Earnings Before Interest and Taxes |
Revenue minus expenses excluding tax and interest |
|
4 |
EBITDA |
Earnings Before Interest, Taxes, Depreciation, and Amortization |
EBIT + depreciation + amortization |
|
5 |
Operating working capital |
Operating current assets minus operating current liabilities |
Operating current assets minus operating current liabilities |
|
Non-financial variables |
|||
|
6 |
Gender employment gap |
The disparity in employment rates between men and women aged 20 to 64 (as a percentage of the total population) (Eurostat, 2023a) |
The number of employed persons aged 20 to 64, divided by the total population of the same age group (Eurostat, 2023a) |
|
7 |
Final energy consumption |
Energy consumed by end users in the country (in tonnes of equivalent oil per capita) excluding energy used for non-energy purposes. The variable includes only the energy consumed by end users, such as transport, industry, services, households and agriculture; energy consumption by the energy sector itself and losses resulting from energy transformation and distribution is excluded (Eurostat, 2023b) |
- |
|
8 |
Total population living in households considering that they suffer from noise (Eurostat, 2023c) |
The percentage of people who claim that noise from the street or from their neighbors negatively affects them (as a percentage of the population) (Eurostat, 2023c) |
The number of persons declaring that they are affected either by noise from the street or from their neighbors divided by the total population (Eurostat, 2023c) |
|
9 |
Greenhouse gas emissions |
Total emissions of the country (in tonnes per capita) of the so called ‘Kyoto basket’ of greenhouse gases, including carbon dioxide (CO2), nitrous oxide (N2O), methane (CH4), and the so-called F-gases (perfluorocarbons, hydrofluorocarbons, nitrogen trifluoride (NF3) and sulfur hexafluoride (SF6)) from all sectors of the GHG emission inventories (including international aviation and indirect CO2) (Eurostat, 2023d) |
- |
|
10 |
Corruption Perceptions Index |
A rank based on the perception of a country’s public sector as corrupt, where a score of 0 represents a very high level of corruption and a score of 100 represents a very clean country (Eurostat, 2023e) |
Composite index based on a combination of surveys and evaluation of corruption from 13 distinct sources and scores (Eurostat, 2023e) |
Source: Own elaboration based on Eurostat (2023). Retrieved from https://ec.europa.eu/eurostat/en/
Secondary data come from the BACH database and Eurostat database. The spatial scope of the study concerns such countries as Austria, Belgium, Croatia, Czech Republic, France, Germany, Italy, Poland, Portugal, Slovakia, and Spain. They cover the period from 2008 to 2020. The study analyzed 6,864 observations, that is, 96,096 data cells. It gives 624 observations for each country separately. The quantitative data are divided into two groups: financial and non-financial. This dataset has been extended to include qualitative data on a nominal scale:
- Business sector: Agriculture, forestry and fishing; Electricity, gas, steam, and air conditioning supply; Extraction of crude petroleum and natural gas; Manufacture of chemicals and chemical products; Manufacture of computer, electronic and optical products; Manufacture of electrical equipment; Manufacture of motor vehicles, trailers and semi-trailers; Manufacture of other transport equipment; Mining and quarrying; Mining of coal and lignite; Mining of metal ores; Transportation and storage.
- Size of enterprise: Large, medium, small, SMSs.
Table 2 contains annual average values for financial variables and Table 3 contains annual average values for non-financial variables.
Table 2. Annual average values of financial variables from 2008 to 2020
|
Country |
Total assets |
Net turnover |
EBITDA |
EBIT |
Operating working capital |
|
Austria |
3610.89 |
2981.09 |
375.42 |
208.28 |
199.51 |
|
Belgium |
6917.41 |
3425.65 |
472.15 |
288.17 |
167.67 |
|
Croatia |
744.19 |
396.73 |
57.17 |
20.65 |
38.70 |
|
Czech Republic |
1432.24 |
1466.84 |
185.35 |
117.95 |
110.81 |
|
France |
22005.32 |
14298.36 |
1531.50 |
843.87 |
1208.95 |
|
Germany |
23318.45 |
24282.57 |
1843.24 |
1090.58 |
1402.39 |
|
Italy |
22389.69 |
13752.62 |
1761.41 |
913.66 |
1842.44 |
|
Poland |
5235.42 |
4471.11 |
563.74 |
273.57 |
643.92 |
|
Portugal |
3186.09 |
1572.30 |
281.42 |
158.57 |
139.93 |
|
Slovakia |
675.34 |
643.53 |
56.45 |
25.45 |
39.47 |
|
Spain |
11541.35 |
6294.95 |
854.57 |
486.58 |
742.65 |
|
Total |
9186.94 |
6689.61 |
725.67 |
402.49 |
594.22 |
Note: These means statistically differ from each other (in the sense of the Kruskal-Wallis test) in about 80% of the investigated countries for each variable (multiple comparisons).
Source: Own calculation based on data from the BACH and Eurostat databases.
Based on the analyzed data, it can be concluded that the countries differ statistically from each other in terms of the examined financial and non-financial characteristics. To explore the data pattern, it was verified whether the nominal scale expressions, i.e., country, size, and sector (hidden variables), significantly differentiate the financial characteristics. For this purpose, the ANOVA method and the Wilks multivariate significance test (Table 4) were used.
Table 3. Annual average values for non-financial variables from 2008 to 2020
|
Country |
Gender employment gap |
Final energy consumption |
Total population living in households considering that they suffer from noise |
Greenhouse gas emissions |
Corruption Perceptions Index |
|
Austria |
9.08 |
3.21 |
18.85 |
9.62 |
75.54 |
|
Belgium |
9.98 |
3.20 |
17.66 |
11.27 |
74.69 |
|
Croatia |
10.74 |
1.62 |
9.72 |
6.11 |
46.08 |
|
Czech Republic |
17.02 |
2.35 |
14.99 |
12.67 |
52.00 |
|
France |
6.88 |
2.25 |
17.75 |
7.41 |
69.69 |
|
Germany |
9.22 |
2.62 |
25.70 |
11.35 |
79.77 |
|
Italy |
19.84 |
1.99 |
17.44 |
7.86 |
45.85 |
|
Poland |
14.55 |
1.75 |
14.16 |
10.65 |
57.08 |
|
Portugal |
7.52 |
1.61 |
23.43 |
6.80 |
61.85 |
|
Slovakia |
14.43 |
1.98 |
14.63 |
7.88 |
47.85 |
|
Spain |
11.58 |
1.80 |
17.52 |
7.70 |
60.62 |
|
Total |
11.89 |
2.22 |
17.44 |
9.03 |
61.00 |
Note: These means statistically differ from each other (in the sense of the Kruskal-Wallis test) in about 90% of the investigated countries for each variable (multiple comparisons).
Source: Own calculation based on data from the BACH and Eurostat databases.
Table 4. The Wilks multivariate significance test for financial characteristics
|
Effect |
Test |
Value |
F |
Effect (df) |
Error (df) |
p-value |
|
Const |
Wilks |
0.4004 |
1896.060 |
5 |
6332.00 |
< 1% |
|
Country |
Wilks |
0.2913 |
179.407 |
50 |
28881.73 |
< 1% |
|
Size |
Wilks |
0.3833 |
483.948 |
15 |
17480.27 |
< 1% |
|
Sector |
Wilks |
0.2206 |
205.783 |
55 |
29312.97 |
< 1% |
|
Country*Size |
Wilks |
0.1905 |
83.163 |
150 |
31316.31 |
< 1% |
|
Country*Sector |
Wilks |
0.0398 |
52.146 |
550 |
31639.42 |
< 1% |
|
Size*Sector |
Wilks |
0.1184 |
102.364 |
165 |
31376.11 |
< 1% |
|
Country*Size*Sector |
Wilks |
0.0048 |
36.721 |
1650 |
31662.99 |
< 1% |
Source: Own calculation based on data from the BACH and Eurostat databases.
As shown in Table 4, such variables as total assets, net turnover, EBITDA, EBIT, and operating working capital are significantly differentiated by country, sector, and company size. Thus, we can treat these hidden variables as a discrimination criterion (division into clusters). Taking into account all financial characteristics and hidden variables (country, sector, and size), the optimal number of clusters was determined using the k-means method, equal to 2 (the optimal number of clusters was selected based on a V-fold cross-validation and cost sequence plot). Tables 5 and 6 contain information on the components of clusters, clusters 1 and 2, respectively. Cluster 2 achieves better financial results than cluster 1, as shown in Figure 2.
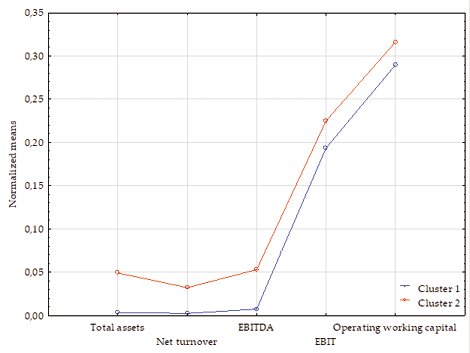
Figure 2. Normalized means of financial characteristics for 2 clusters (k-means)
Source: Own calculation based on data from the BACH and Eurostat databases.
Table 5. Cluster 1 components by the k-means method
|
Countries |
Sectors |
Size |
|
Austria, Belgium, Croatia, Germany, Italy, Poland, Portugal, Slovakia, Spain |
Agriculture, forestry and fishing |
all |
|
Austria, Belgium, Croatia, Germany, Italy, Poland, Portugal, Slovakia, Spain |
Extraction of crude petroleum and natural gas; Manufacture of motor vehicles, trailers and semi-trailers; Manufacture of other transport equipment; Mining and quarrying; Mining of coal and lignite; Mining of metal ores |
medium, small, SMSs |
|
Austria, Belgium, Croatia, Germany, Poland, Portugal, Slovakia, Spain |
Manufacture of chemicals and chemical products; Manufacture of electrical equipment |
medium, small, SMSs |
|
Austria, Belgium, Croatia, Poland, Portugal, Slovakia, Spain |
Manufacture of computer, electronic and optical products |
medium, small, SMSs |
|
Austria, Belgium, Croatia, Germany, Italy, Poland, Portugal, Slovakia, Spain |
Electricity, gas, steam and air conditioning supply |
medium |
|
Austria, Croatia, Slovakia |
Transportation and storage |
medium, small, SMSs |
|
Germany, Poland, Portugal, Spain |
Transportation and storage |
medium, small |
|
Belgium, Italy |
Transportation and storage |
medium |
|
Germany, Italy |
Manufacture of computer, electronic and optical products |
medium, small |
|
Czech Republic |
Extraction of crude petroleum and natural gas; Manufacture of chemicals and chemical products; Manufacture of computer, electronic and optical products; Manufacture of electrical equipment; Manufacture of motor vehicles, trailers and semi-trailers; Manufacture of other transport equipment; Mining of coal and lignite; Mining of metal ores; Transportation and storage |
all |
|
France |
Agriculture, forestry and fishing; Extraction of crude petroleum and natural gas; Manufacture of chemicals and chemical products; Manufacture of computer, electronic and optical products; Manufacture of electrical equipment; Manufacture of motor vehicles, trailers and semi-trailers; Manufacture of other transport equipment; Mining and quarrying; Mining of coal and lignite; Mining of metal ores |
medium |
|
Italy |
Manufacture of chemicals and chemical products; Manufacture of electrical equipment |
medium, small |
Source: Own calculation based on data from the BACH and Eurostat databases.
Table 6. Cluster 2 components using the k-means method
|
Countries |
Sectors |
Size |
|
Austria, Belgium, Croatia, Czech Republic, Germany, Italy, Poland, Portugal, Slovakia, Spain |
Manufacture of motor vehicles, trailers and semi-trailers |
large |
|
Austria, Belgium, Croatia, Germany, Italy, Poland Portugal, Slovakia, Spain |
Manufacture of other transport equipment; Mining and quarrying; Mining of coal and lignite |
large |
|
Austria, Belgium, Croatia, Germany, Poland, Portugal, Slovakia, Spain |
Manufacture of chemicals and chemical products; Manufacture of electrical equipment |
large |
|
Austria, Belgium, Croatia, Germany, Italy, Portugal, Slovakia, Spain |
Extraction of crude petroleum and natural gas |
large |
|
Austria, Belgium, Croatia, Italy, Poland, Portugal, Slovakia, Spain |
Electricity, gas, steam and air conditioning supply |
large, small, SMSs |
|
Austria, Belgium, Croatia, Poland, Portugal, Slovakia, Spain |
Manufacture of computer, electronic and optical products |
large |
|
Austria, Belgium, Croatia, Italy, Slovakia, Spain |
Mining of metal ores |
large |
|
Austria, Germany, Poland, Portugal |
Transportation and storage |
large, SMSs |
|
Belgium, Italy, Spain |
Transportation and storage |
large, small, SMSs |
|
Croatia, Slovakia |
Transportation and storage |
large |
|
France, Germany |
Agriculture, forestry and fishing |
large, small, SMSs |
|
Germany, Italy |
Manufacture of computer, electronic and optical products |
large, SMSs |
|
Czech Republic |
Electricity, gas, steam and air conditioning supply |
large |
|
France |
Extraction of crude petroleum and natural gas; Manufacture of chemicals and chemical products; Manufacture of computer, electronic and optical products; Manufacture of electrical equipment; Manufacture of motor vehicles, trailers and semi-trailers; Manufacture of other transport equipment; Mining and quarrying; Mining of coal and lignite; Mining of metal ores |
large, small, SMSs |
|
Italy |
Manufacture of chemicals and chemical products; Manufacture of electrical equipment |
large, SMSs |
|
France |
Transportation and storage |
all |
Source: Own calculation based on data from the BACH and Eurostat databases.
RESULTS
The division of observations into two clusters allowed the classification of sectors and the economic entities that belong to them with relatively better and relatively worse financial conditions. Cluster 2 is identified with entities with the better financial condition than cluster 1. It can be assumed that the cluster is a hidden variable. In an attempt to answer the question of whether entities with a relatively better/worse financial condition statistically differentiate ESG indicators at the national level (non-financial data), the Mann-Whitney U test (with continuity correction) was used (Table 7).
Based on the results from Table 7, it can be seen that there are statistical differences between entities with relatively good financial conditions and relatively weaker financial conditions in the context of such values as gender employment gap, total population living in households considering that they suffer from noise, greenhouse gas emission, Corruption Perceptions Index. It is complemented by box-whisker charts showing the basic positional measures (Figure 3).
Table 7. The Mann-Whitney U test results
|
Variable |
Sum of rang |
Sum of rang |
U |
Z |
p |
Z (corrected) |
p |
|
Gender employment gap |
17 078 367 |
6 482 313 |
4 003 662 |
15.07 |
0.00 |
15.08 |
0.00 |
|
Final energy consumption |
15 803 535 |
7 757 145 |
5 045 694 |
-1.51 |
0.13 |
-1.51 |
0.13 |
|
Total population living in households considering that they suffer from noise |
15 504 375 |
8 056 305 |
4 746 534 |
-5.41 |
0.00 |
-5.41 |
0.00 |
|
Greenhouse gas emissions |
16 776 207 |
6 784 473 |
4 305 822 |
11.14 |
0.00 |
11.15 |
0.00 |
|
Corruption Perceptions Index |
15 244 143 |
8 316 537 |
4 486 302 |
-8.79 |
0.00 |
-8.80 |
0.00 |
Note: Results that are not statistically significant are marked by underlines.
Source: Own calculation based on data from the BACH and Eurostat databases.
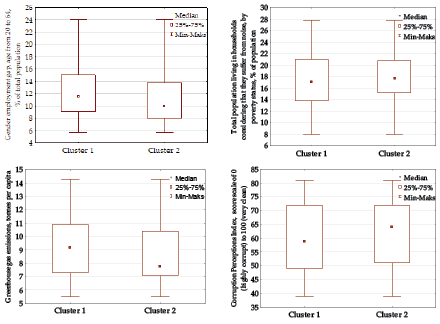
Figure 3. Box-whisker charts for ESG results (non-financial variables)
Source: Own elaboration based on data from the BACH and Eurostat databases.
Based on Figure 3, it can be emphasized that economic entities with relatively better financial conditions achieve a smaller gender employment gap (at the national level) than entities with relatively worse financial conditions. It is similar to the GHG level: economic entities with relatively better financial conditions generate lower GHG emissions (national level) than entities with relatively worse financial results. In the case of the analysis of the Corruption Perceptions Index, it can be concluded that there is a lower level of corruption in companies with better financial results than those with worse financial results. Surprisingly, the population’s exposure to noise is higher, where enterprises achieve relatively better financial results than worse financial results.
The obtained results directly relate to the activities of companies. Companies with a better financial position are companies that achieve market success, and therefore respond more effectively to the needs of a wide range of stakeholders, and are more and more sensitive to the issues of sustainable development. The implementation of sustainable development into a company’s strategy, or the transformation of the business model towards a sustainable business model, requires financial outlays. It involves modern, more ecological methods of production or provision of services, which directly contributes to reducing greenhouse gas emissions. However, the modernization of production processes is unfortunately associated with an increase in the noise level resulting from the use of extensive installations and the operation of machinery and equipment. Companies with a better financial condition also pay attention to the transparency of their operations. They take care of introducing and observing internal regulations and procedures and their compliance with applicable law, which results in a lower level of the Corruption Perceptions Index. Companies with better financial results are usually open to changes and novelties, which translates into a smaller gender employment gap.
In further analysis, one-way ANOVA was used to examine the impact of the cluster (a hidden variable that expresses the financial condition of the enterprises) on non-financial variables (ESG results). The results (Table 8) are presented at the general level and the detailed level due to the size of the enterprise (using a cross-assessment).
When examining the interdependence of ESG goals, it can be seen that in general, the gender employment gap is 0.68 percentage points lower in financially better enterprises than in less financially healthy enterprises. This difference is statistically significant. The financial condition of enterprises explains the variability of the gender employment gap at around 2.29%. For large companies, better-off companies achieve a 1.6 percentage point lower gender employment gap than less well-off companies; in the case of medium companies the difference is 1.62 percentage points, small companies are 1.37 percentage points and SMSs are 0.85 percentage points.
Table 8. Model of dependence of ESG goals on the financial condition of enterprises
|
All companies |
||||||||
|
|
Effect 1 |
Effect 2 |
Effect 3 |
Effect 4 |
||||
|
Effect |
Gender employment gap |
p |
Population suffering from noise |
p |
GHG emissions |
p |
Corruption Perceptions Index |
p |
|
const |
11.66 |
< 1% |
17.54 |
< 1% |
8.91 |
< 1% |
61.50 |
< 1% |
|
Cluster = 2 |
-0.68 |
< 1% |
0.27 |
< 1% |
-0.34 |
< 1% |
1.43 |
< 1% |
|
Multiple R |
15.14% |
< 1% |
5.33% |
< 1% |
14.87% |
< 1% |
10.89% |
< 1% |
|
Multiple R2 |
2.29% |
< 1% |
0.28% |
< 1% |
2.21% |
< 1% |
1.19% |
< 1% |
|
Large companies |
||||||||
|
const |
13.02 |
< 1% |
16.94 |
< 1% |
9.79 |
< 1% |
59.03 |
< 1% |
|
Cluster = 2 |
-1.60 |
< 1% |
0.72 |
< 1% |
-1.08 |
< 1% |
2.79 |
< 1% |
|
Multiple R |
26.95% |
< 1% |
10.57% |
< 1% |
35.58% |
< 1% |
16.11% |
< 1% |
|
Multiple R2 |
7.26% |
< 1% |
1.12% |
< 1% |
12.66% |
< 1% |
2.59% |
< 1% |
|
Medium companies |
||||||||
|
const |
10.36 |
< 1% |
18.71 |
< 1% |
8.84 |
< 1% |
65.58 |
< 1% |
|
Cluster = 2 |
-1.62 |
< 1% |
1.33 |
< 1% |
-0.19 |
25% |
4.82 |
< 1% |
|
Multiple R |
11.87% |
< 1% |
8.58% |
< 1% |
2.79% |
25% |
12.11% |
< 1% |
|
Multiple R2 |
1.41% |
< 1% |
0.74% |
< 1% |
0.08% |
25% |
1.47% |
< 1% |
|
Small companies |
||||||||
|
const |
11.02 |
< 1% |
17.54 |
< 1% |
8.68 |
< 1% |
62.66 |
< 1% |
|
Cluster = 2 |
-1.37 |
< 1% |
0.15 |
33% |
-0.55 |
< 1% |
2.59 |
< 1% |
|
Multiple R |
24.95% |
< 1% |
2.37% |
33% |
19.42% |
< 1% |
16.15% |
< 1% |
|
Multiple R2 |
6.23% |
< 1% |
0.06% |
33% |
3.77% |
< 1% |
2.61% |
< 1% |
|
SMSs companies |
||||||||
|
const |
11.45 |
< 1% |
17.71 |
< 1% |
8.81 |
< 1% |
62.15 |
< 1% |
|
Cluster = 2 |
-0.85 |
< 1% |
0.52 |
< 1% |
-0.43 |
< 1% |
2.22 |
< 1% |
|
Multiple R |
17.26% |
< 1% |
9.35% |
< 1% |
17.17% |
< 1% |
15.46% |
< 1% |
|
Multiple R2 |
2.98% |
< 1% |
0.87% |
< 1% |
2.95% |
< 1% |
2.39% |
< 1% |
Note: Bonferroni and Scheffé tests were used when the samples were few but equal variances and Dunnett’s test when the samples were few and unequal variances (so-called corrections). In all the cases analyzed, the desired properties were obtained (significant differences between the groups). Results that are not statistically significant are marked by underlines.
Source: Own elaboration based on data from the BACH and Eurostat databases.
The financial condition of enterprises explains the variability of the gender employment gap which is approx. 7.26%, 1.41%, 6.23%, and 2.98%, respectively, in small, large, medium, and SMSs companies.
The analysis also shows that enterprises with a better financial condition contribute to a greater emissivity of noise in the perception of the population than enterprises with a worse financial condition. The differences are statistically significant for the general analysis and large, medium, and SMSs companies. This difference is not statistically significant for small companies. Overall, the financial condition explains the population’s exposure to noise at 0.28%. The biggest difference was recorded in medium companies, where companies with a better performing business, report a higher noise emission by 1.33 percentage points than less profitable companies. For large enterprises the difference is 0.72 percentage points, for SMSs 0.52 percentage points, and globally 0.27 percentage points.
The second environmental effect, in addition to noise emission, is GHG emission. Globally, the lower emission of GHG is recorded by 0.34 tonnes per capita for companies with better financial conditions than for worse ones. The volatility of GHG emissions is explained in 2.21% by the financial condition of companies worldwide (but it is statistically significant). In the case of large companies, companies with a better financial condition generate 1.08 tonnes per capita less GHG emissions than companies with a worse financial condition; this variability can be explained by the financial condition up to approximately 12.7%. In the case of companies, no statistically significant results were obtained. Enterprises in the segment of small companies that are relatively better prospering achieve lower GHG emissions by 0.55 tonnes per capita compared to enterprises with relatively worse financial results. However, in the SMSs segment, the difference is 0.43 tonnes per capita.
The fourth effect concerns the Corruption Perceptions Index; an increase in its value means the minimization of corrupt practices.
The volatility of the level of the Corruption Perceptions Index is explained by the financial condition of enterprises at 1.19%. The obtained ratio is 1.43 (index) higher in the case of enterprises with better financial conditions than in the case of relatively worse ones. More prospering enterprises achieve a higher level of corruption elimination than enterprises with weaker financial results. The largest such difference was recorded in enterprises in the medium companies segment and amounts to 4.82 (index). Companies that are more prosperous in the large, medium, and SMSs companies segment achieve similar differences in the Corruption Perceptions Index compared to the less prospering ones, respectively, 2.79, 2.59, and 2.22 (index). These differences are statistically significant.
The second part of the analysis is based on the example of large companies from the transport and storage sector. Table 9 shows the dependence of the effects of ESG on the financial results of the companies studied.
Table 9. Influence of the financial condition of large companies from the transport and storage sector on the ESG effects
|
Effect |
Test |
Value |
F |
p |
Partial eta-squared |
|
Const |
Wilks |
0.0070 |
4898.44 |
0.00 |
99.30% |
|
company financial conditions |
Wilks |
0.4176 |
48.11 |
0.00 |
58.24% |
Source: Own elaboration based on data from the BACH and Eurostat databases.
About 58% of the financial results of large enterprises from the transport and storage sector explain all non-financial results in the field of achieving ESG, and it is a statistically significant relationship. The development is to examine the dependence of the achievement of ESG goals on the financial condition of this group of enterprises (Table 10).
Table 10. Model of dependence of ESG goals on the financial condition of enterprises large companies from sector transport and storage sector
|
Effect |
Gender employment gap |
p |
Population suffering from noise |
p |
GHG emissions |
p |
Corruption Perceptions Index |
p |
|
const |
12.42 |
< 1% |
16.38 |
< 1% |
9.03 |
< 1% |
58.00 |
< 1% |
|
Cluster = 2 |
-1.37 |
< 1% |
2.75 |
< 1% |
-0.01 |
94% |
7.80 |
< 1% |
|
Multiple R |
30.04% |
< 1% |
52.84% |
< 1% |
0.55% |
94% |
58.52% |
< 1% |
|
Multiple R2 |
9.03% |
< 1% |
27.92% |
< 1% |
0.00% |
94% |
34.25% |
< 1% |
Note: Dunnett’s test was used when the samples were few and unequal variances (so-called corrections). In all the cases analyzed, the desired properties were obtained (significant differences between the groups). Results that are not statistically significant are marked by underlines.
Source: Own elaboration based on data from the BACH and Eurostat databases.
Based on the above model, it is observed that in the analyzed group of enterprises, those that were in a relatively better financial situation had a lower gender employment gap of 1.37 percentage points compared to less prospering enterprises. The variability of the employment gap for this group of companies was explained by financial results of up to approximately 9%.
At the same time, the wealthiest companies were also 2.75 percentage points higher in terms of noise emissions than the least wealthy. Noise emissivity can be explained by the financial condition of companies by as much as 28%. This can be explained by the fact that the rolling stock and equipment of transport companies or the superstructure of warehouses could be more overloaded, more exploited, or larger, have parameters which, in the subjective opinion of the population, caused more noise than in companies with a worse financial condition.
There were no statistical differences in the GHG emissivity depending on the financial condition of the enterprises. This may be because major transport companies are obliged to systematically renew their car fleet and vehicle manufacturers are required to produce fewer emission vehicles. Vehicles that do not meet strict environmental standards cannot provide transportation services. At the same time, the fuels used in vehicles have similar parameters, which are the result of the megatrends of modern civilization. Thus, the financial condition of the companies may not differentiate in this case the emissivity of GHG.
Up to 34% of the Corruption Perceptions Index is explained by the financial condition of the surveyed companies. It is noted that the level of corruption is 7.8 percentage points higher in better-than-worse enterprises.
The research results obtained for the transport sector (Tables 9 and 10) will be confronted with the description of the activities of three selected companies, to show how the process of transforming companies towards sustainable development looks in practice.
The scope and nature of adaptation activities will depend on the individual needs of the enterprise. Raben N.V. Group currently operates in 15 European countries, owns a transport network and approximately 1,400,000 m2 of warehouse space in more than 160 locations, delivering over 16 million shipments per year. The company has a sustainable development strategy based on 3 pillars and 9 strategic areas, i.e., environmental protection (climate change, circular economy, and ecological initiatives), social impact (occupational health and safety, employee diversity and integration), responsible organization (Ethics and Compliance, Risk Management, and Sustainable Procurement).
The company is aware of its impact on the natural environment and takes responsibility for it, constantly trying to minimize its impact through activities such as investments in renewable energy sources, and modern transport equipment and efficient warehouses. In addition, the company strives to ensure efficient truck filling, optimal route planning and a reduction in empty runs, and is introducing the first zero- or low-emission trucks into its fleet. Waste is segregated in warehouses and offices, energy-saving technologies and environmentally friendly solutions are introduced, such as low-emission refrigerants, and other solutions supporting the circular economy in warehouses. The company also encourages customers to switch to e-invoicing, supports the digitization of processes and ensures that chemicals are properly handled during transport and storage. The company also maintains good contacts with stakeholders. It takes care of employees and contacts with business partners. The company also uses sustainable financing. In July 2021 it obtained one of the first Sustainability Linked Loans (SLL) in Europe for the logistics sector. The company undertook to reduce the intensity of CO2 emissions from its facilities by 30% and from transport by 10%, and increase the share of the fleet that meets the Euro 5 / Euro 6 emission standards or has an LNG / CNG / electric / hydrogen drive from 73% to 96%. The company also declares increasing the proportion of women in management positions to 34% by 2025 and confirms the use of ESG management best practices by gradually improving its EcoVadis rating (Raben Group, 2022).
Garza-Reyes et al. (2016) described the sustainable adaptation of a division of a transportation company’s operations center located in Monterrey, Mexico. The center provides online tracking services, cross-border freight services, brokerage services in truck transport and the delivery of government packages, controlled temperature packages, and consolidation and distribution services. It serves around 4,000 customers a day with an average of 4,500 parcels per day. They are delivered on 28–32 routes per day. Sustainable adaptation was carried out as part of the Transporte Limpio (Clean Transport) project, which aimed to promote and support Mexican organizations in their efforts to protect the environment as part of sustainable development. In the case of the discussed center, the adaptation consisted in optimizing the process of loading and transporting shipments to recipients by improving the assignment of customers to routes and better sequencing of customers on each route, which resulted in shortening the routes and thus the delivery time. Based on the experience of companies such as DHL and FedEx, an environmental strategy has been pre-defined to develop more efficient route schemes, use hybrid vehicles, alternative fuels, and to invest in new technologies. The organization of the work of drivers and their assistants has also been improved, thus reducing labor costs and shortening the time of order fulfilment.
The adaptation process towards sustainable logistics introduced by Deutsche Post DHL Group focuses on three key action areas in which the company can achieve the biggest effects: clean operations for climate protection, great company to work for all, and a highly trusted company (Deutsche Post DHL Group, 2022). In the first of those areas, the company focuses on reducing logistics-related greenhouse gas emissions by the use of sustainable technologies and fuels, electrification of its road fleet, developing a green product portfolio, and climate-neutral design of new buildings. The adaptation effectiveness indicator is Realized Decarbonization Effects, which amounted to 728 kilotonnes of CO2 equivalent in 2021 and is planned to reach 969 kilotonnes of CO2 equivalent. To make a company a good place to work for all, they aim at improving employee engagement, diversity and inclusion, and occupational health and safety. In order to achieve these goals, the company attracts and retains the best talent, promotes equal opportunities, and creates a healthy and safe work environment. They plan to increase the proportion of women in executive positions from 25.1% in 2021 to at least 30% in 2025. The company has also taken actions to increase employee engagement, and to decrease lost time injury frequency rate (LTIFR) from 3.9 in 2021 to below 3.1 in 2025. Finally, to become a highly trusted company, they focus on cybersecurity, respecting human rights, and providing services in compliance with current legislation and in accordance with the company’s values. To achieve these goals, the company provides compliance-relevant training, improves cybersecurity, and builds sustainable relations with suppliers. The company has implemented a human rights management system and conducts audits related to human rights. The effectiveness in the area of compliance is assessed by the number of valid compliance-relevant training certificates in middle and upper management.
DISCUSSION
The conducted research shows that enterprises with a better financial condition have a higher Corruption Perceptions Index, and therefore are more effective in minimizing corrupt practices. Studies on the relationship between corruption and the financial performance of SMEs were carried out by Van et al. (2018). They showed that corruption negatively affects the financial results of SME enterprises. Similar studies on newly established companies were carried out by Nam et al. (2020). They found that corruption not only impairs the financial performance of these companies, but it also has a detrimental effect on their functioning and their ability to survive. Ojeka et al. (2019) conducted research on the impact of corruption perceptions and the performance of publicly traded companies in Nigeria. Their research shows that corruption negatively affects the market value (TorbinQ) and the return on assets (ROA). Donadelli et al. (2014) showed that the level of corruption has a negative impact on stock returns. Corruption and a weak institutional environment tend to worsen the market and accounting performance of non-financial companies (Ojeka et al., 2019). Hoang et al. (2022) showed that anti-corruption campaigns positively translate into the financial results of private companies. According to this study, counteracting corruption benefits private companies by improving the institutional quality of the country while improving the financial transparency of state-owned companies.
This research shows that the gender difference in employment is lower in enterprises with a better financial condition than in enterprises with a weaker condition. Research on the increase in the number of women on management boards, and their impact on the financial results of enterprises, was carried out by Reguera-Alvarado et al. (2017) on a group of 125 non-financial companies listed on the Madrid Stock Exchange from 2005 to 2009. The research shows that in the analyzed period the number of women on boards increased by 98%, which confirms the effectiveness of the legislation in this area. The presence of women on the management board also had a positive impact on the financial results of enterprises. Similar studies were conducted by Maji and Saha (2021) on 100 Indian corporations. The obtained results confirmed the influence of the gender diversity of the workforce (including in managerial positions) on the financial results of companies. On a sample of companies from 23 developed countries in 2001–2014, Lopatta et al. (2020) examined the relationship between the presence of employee and female representatives on the management board and the company’s performance in the field of environmental protection and CSR, and they confirmed that this relation is positive. Based on an analysis of India’s publicly traded companies in 2010–2019, Oware and Mallikarjunapp (2021) showed that an improvement in return on equity prices leads to an increase in female employment.
This research shows that there are two correlations, i.e., companies with a better financial condition have lower greenhouse gas emissions and contribute to higher noise emissions. Such dependencies may result from the fact that enterprises with a better financial condition have more modern, more innovative and, therefore, more ecological machines and equipment. Mensah et al. (2018), based on data from 28 OCED countries between 1990 and 2014, showed that innovation plays a key role in mitigating CO2 emissions in most OECD countries. Similar conclusions were reached by Su and Moaniba (2017), who showed that the development of technology (climate innovation) negatively affects the emission of CO2 and other greenhouse gases. Innovation also contributes to the improvement of the financial results of enterprises. This relationship was demonstrated, among others, by Bigliardi (2012), Černe et al. (2015) and Chouaibi (2021). At this point, however, it is worth mentioning that the introduction of innovations in a company (e.g., new products) does not always translate into an increase in financial results. Such a relationship resulted from a study by de Oliveira et al. (2018).
The vast majority of scientific publications are devoted to the analysis of the negative impact of noise on employee productivity (Hong at al., 2023; Cahyani, 2020). Wang et al. (2020) studied noise levels in a tobacco company and Chabuk et al. (2020) in textile enterprises. From both studies, it appears that the noise level was exceeded and had a negative impact on employees. Farhang et al. (2013) assessed noise exposure and noise nuisance in a petrochemical company. The research shows that 63.2% of employees working in production departments and 17.9% of administrative employees described the noise level as very high. It can therefore be concluded that the main source of noise in enterprises are production machines, and the noise level increases with the development of the machinery park.
CONCLUSIONS
The relationships between ESG and financial performance factors have been well documented in corporate finance. However, no in-depth research indicates the relationship between the financial condition and non-financial results achieved by enterprises. The article tries to fill this research gap. The study attempts to explain the relationships between financial and non-financial factors’ impact on enterprises. An attempt was made to group enterprises by sector, size, country, and achieved financial results, to verify the enterprises’ profile in terms of adapting business models to sustainability. The analysis encompasses 11 EU countries in the period 2008–2020. The study analyzed 6,864 observations, that is, 96,096 data cells. The data are divided into two groups: financial and non-financial, and the paper is based on clusters analysis and ANOVA. As a result of the study, two clusters of enterprises were obtained.
The first cluster covered large enterprises with a solid financial standing. The second cluster included mainly small and medium-sized enterprises and weaker financial situations. For the first and second clusters, the business sector and the state where the enterprise conducts business did not constitute a differentiating factor. In the next step, it was verified what non-financial performance is obtained by enterprises from the first and second clusters. As a result of the research, it turned out that large enterprises with a solid financial position simultaneously get better non-financial results, i.e., better adapt their business models to sustainability. In each of the analyzed aspects, i.e., values such as gender employment gap, total population living in households considering that they suffer from noise, greenhouse gas emission, and Corruption Perceptions Index, large enterprises with an excellent financial standing did better. One of the reasons for this may be that large enterprises have better access to external financing and a broader scope of cooperation with financial institutions. Therefore, financing the costs of transformation of business models towards sustainability may be easier in these enterprises. Due to their market position, large enterprises can negotiate individual financing conditions with a financial institution, which means that the cost of capital may be lower for this group of enterprises. Small and medium-sized enterprises have a limited negotiating position in cooperation with financial institutions. At the same time, large enterprises are usually listed companies obliged to disclose financial and non-financial information to their stakeholders. Hence these entities have an additional incentive to make decisions on implementing sustainable business models because they have a higher reputation risk for SMEs. Activities in the field of building sustainable business models require financing. Therefore, entities with good financial conditions with access to external funding can implement such models effectively. In these entities, one can see strong relationships between financial and non-financial factors and financial and non-financial performance factors. SMEs usually have a less stable financial situation than large enterprises, which results from the scale of operations and market position; they are not always listed companies or entities subject to non-financial reporting obligations. The limitations of the study result from the assumptions of the method used. This required researchers to run numerous tests, including robust tests of equality of means for the ESG goals model. The Welch test and the Brown-Forsythe test were used for this purpose. The test result was one of the reasons why final energy consumption was excluded from the business model (supplementary material 1). However, this approach could be extended by dividing the research period into two sub-periods, 2008–2014 and 2015–2020 (supplementary material 2). As a result of extending this analysis by an additional step, additional information could be obtained, and the inclusion of final energy consumption (important ESG goals) in the analysis. Such an analysis would require additional restrictions, i.e., analysis of structural breaks and the selection of sub-periods due to statistical properties. This would be possible by adapting the QLR or Chow test in the pre-analysis. Nevertheless, such an approach would be a direction for future research and extension of the methodology on business models. Future work will focus on deepening the knowledge of enterprises’ methods and directions of adaptation activities depending on their size and location.
Acknowledgment
Research results are a part of research project financed by the National Science Center Poland (NCN) OPUS16 2018/31/B/HS4/00570
References
Abdelkafi, N., Xu, J., Pero, M., Ciccullo, F., & Masi, A. (2023). Does the combination of sustainable business model patterns lead to truly sustainable business models? Critical analysis of existing frameworks and extensions. Journal of Business Economics, 93(4), 597-634. https://doi.org/10.1007/s11573-023-01140-0
Alkaya, E., Bogurcu, M., Ulutas, F., & Demirer, G. N. (2015). Adaptation to climate change in industry: Improving resource efficiency through sustainable production applications. Water Environment Research, 87(1), 14-25. https://doi.org/10.2175/106143014X14062131178952
Armstrong, R. A. (2014). When to use the Bonferroni correction. Ophthalmic and Physiological Optics, 35(5), 502–508. https://doi.org/10.1111/opo.12131
Ball, P., & Lunt, P. (2020). Lean eco-efficient innovation in operations through the maintenance organisation. International Journal of Production Economics, 219, 405-415. https://doi.org/10.1016/j.ijpe.2018.07.007
Bigliardi, B. (2013). The effect of innovation on financial performance: A research study involving SMEs. Innovation, 15(2), 245-255. https://doi.org/10.5172/impp.2013.15.2.245
Bocken, N. M., Mugge, R., Bom, C. A., & Lemstra, H. J. (2018). Pay-per-use business models as a driver for sustainable consumption: Evidence from the case of HOMIE. Journal of Cleaner Production, 198, 498-510. https://doi.org/10.1016/j.jclepro.2018.07.043
Bocken, N. M., Short, S. W., Rana, P., & Evans, S. (2014). A literature and practice review to develop sustainable business model archetypes. Journal of Cleaner Production, 65, 42-56. https://doi.org/10.1016/j.jclepro.2013.11.039
Brown, A. M. (2005). A new software for carrying out one-way ANOVA post hoc tests. Computer Methods and Programs in Biomedicine, 79(1), 89–95. https://doi.org/10.1016/j.cmpb.2005.02.007
Cahyani, A. A. (2020). Influence of work environment noise to productivity of employee performance of Sidoarjo District. Journal of Public Health Science Research, 1(1), 12-17. http://dx.doi.org/10.30587/jphsr.v1i1.1181
Casadesus-Masanell, R., & Ricart, J. E. (2010). From strategy to business models and onto tactics. Long Range Planning, 43, 195-215. https://doi.org/10.1016/j.lrp.2010.01.004
Casadesus‐Masanell, R., & Zhu, F. (2013). Business model innovation and competitive imitation: The case of sponsor‐based business models. Strategic Management Journal, 34(4), 464-482. https://doi.org/10.1002/smj.2022
Černe, M., Jaklič, M., & Škerlavaj, M. (2015). Management innovation enters the game: Re-considering the link between technological innovation and financial performance. Innovation 17(4), 429-449. https://doi.org/10.1080/14479338.2015.1126530
Chabuk, A., Hammood, Z. A., Abed, S. A., Kadhim, M. M., Hashim, K., Al-Ansari, N., & Laue, J. (2021, June). Noise level in textile industries: Case study Al-Hillah Textile Factory-Company for Textile Industries, Al-Hillah-Babylon-Iraq. Retrieved from https://iopscience.iop.org/article/10.1088/1755-1315/790/1/012048/pdf
Chasin, F., Paukstadt, U., Gollhardt, T., & Becker, J. (2020). Smart energy driven business model innovation: An analysis of existing business models and implications for business model change in the energy sector. Journal of Cleaner Production, 269, 122083. https://doi.org/10.1016/j.jclepro.2020.122083
Cheah, S., Ho, Y. P., & Li, S., (2018). Business model innovation for sustainable performance in retail and hospitality industries. Sustainability 10(11), 3952. https://doi.org/10.3390/su10113952
Chesbrough, H., & Rosenbloom, R. S., (2002). The role of the business model in capturing value from innovation: Evidence from Xerox Corporation’s technology spin‐off companies. Industrial and Corporate Change, 11(3), 529-555. https://doi.org/10.1093/icc/11.3.529
Chouaibi, J. (2021). Innovation and financial performance in manufacturing companies: An empirical study Tunisian. Journal of the Knowledge Economy, 12(4), 1870-1890. https://doi.org/10.1007/s13132-020-00692-8
Corder, G. W., & Foreman, D. I. (2014). Nonparametric Statistics: A Step-by-Step Approach. New Jersey: John Wiley & Sons.
De Lucia, C., Pazienza, P., & Bartlett, M., (2020). Does good ESG lead to better financial performances by firms? Machine learning and logistic regression models of public enterprises in Europe. Sustainability 12(13), 5317. https://doi.org/10.3390/su12135317
de Oliveira, J. A. S., Basso, L. F. C., Kimura, H., & Sobreiro, V. A. (2018). Innovation and financial performance of companies doing business in Brazil. International Journal of Innovation Studies, 2(4), 153-164. https://doi.org/10.1016/j.ijis.2019.03.001
Demil, B., & Lecocq, X. (2010). Business model evolution: In search of dynamic consistency. Long Range Planning, 43(2-3), 227-246. https://doi.org/10.1016/j.lrp.2010.02.004
Deutsche Post DHL Group (2022). 2021 ESG Presentation. ESG Roadmap Progress to Date. Bonn, March 9. Retrieved from https://www.dpdhl.com/content/dam/dpdhl/en/media-center/investors/documents/presentations/2021/DPDHL-ESG-Presentation-2021.pdf
Doganova, L., & Eyquem-Renault, M. (2009). What do business models do? Narratives, calculation and market exploration. Research Policy, 38(10), 1559-1570. https://doi.org/ 10.1016/j.respol.2009.08.002
Dohrmann, S.; Raith, M., & Siebold, N. (2015). Monetizing social value creation – A Business model approach. Entrepreneurship Research Journal, 5(2), 127–154. https://doi.org/10.1515/erj-2013-0074
Donadelli, M., Fasan, M., & Magnanelli, B. S. (2014). The agency problem, financial performance and corruption: Country, industry and firm level perspectives. European Management Review, 11(3-4), 259-272. https://doi.org/10.1111/emre.12038
Drei, A. Le Guenedal, T. Lepetit, F., Mortier, V. Roncalli, T., & Sekine, T. (2019). ESG investing in recent years: New insights from old challenges. SSRN Electronic Journal. http://dx.doi.org/10.2139/ssrn.3683469
ESG in banks. Effective strategies to use opportunities and mitigate risks KPMG (2021). Retrieved from https://home.kpmg/xx/en/home/insights/2021/05/esg-risks-in-banks.html
Eurostat. (2023a). Gender employment gap, by type of employment. Retrieved from https://ec.europa.eu/eurostat/databrowser/view/SDG_05_30/default/table?lang=en
Eurostat. (2023b). Final energy consumption. Retrieved from https://ec.europa.eu/eurostat/databrowser/view/SDG_07_11/default/table?lang=en
Eurostat. (2023c). Population living in households considering that they suffer from noise. Retrieved from https://ec.europa.eu/eurostat/databrowser/view/SDG_11_20/default/table?lang=en
Eurostat. (2023d). Net greenhouse gas emissions. Retrieved from https://ec.europa.eu/eurostat/databrowser/view/SDG_13_10/default/table?lang=en
Eurostat. (2023e). Corruption Perceptions Index. Retrieved from https://ec.europa.eu/eurostat/databrowser/view/SDG_16_50/default/table?lang=en
Evans, S., Vladimirova, D., Holgado, M., Van Fossen, K., Yang, M., Silva, E. A., & Barlow, C. Y. (2017). Business model innovation for sustainability: Towards a unified perspective for creation of sustainable business models. Business Strategy and the Environment, 26(5), 597-608. https://doi.org/10.1002/bse.1939
Farhang Dehghan, S., Monazzam, M. R., Nassiri, P., Haghighi Kafash, Z., & Jahangiri, M. (2013). The assessment of noise exposure and noise annoyance at a petrochemical company. Journal of health and safety at work, 3(3), 11-24.
Ferreira, J. J., Fernandes, C. I., Veiga, P. M., & Hughes, M. (2021). Prevailing theoretical approaches predicting sustainable business models: A systematic review. International Journal of Productivity and Performance Management, 71(3), 790-813. https://doi.org/10.1108/IJPPM-12-2020-0653
Friede, G., Busch, T., & Bassen,A. (2015). ESG and financial performance: Aggregated evidence from more than 2000 empirical studies. Journal of Sustainable Finance & Investment, 5(4), 210-233, https://doi.org/10.1080/20430795.2015.1118917
Garza-Reyes, J. A., Villarreal, B., Kumar, V., & Molina Ruiz, P. (2016). Lean and green in the transport and logistics sector–a case study of simultaneous deployment. Production Planning & Control, 27(15), 1221-1232. https://doi.org/10.1080/09537287.2016.1197436
Goni, F. A., Gholamzadeh Chofreh, A., Estaki Orakani, Z., Klemeš, J. J., Davoudi, M., & Mardani, A. (2021). Sustainable business model: A review and framework development. Clean Technologies and Environmental Policy, 23, 889–897. https://doi.org/10.1007/s10098-020-01886-z
Grandoni, F., Ostrovsky, R., Rabani, Y., Schulman, L. J., & Venkat, R. (2022). A refined approximation for Euclidean k-means. Information Processing Letters, 176, 106251. https://doi.org/10.1016/j.ipl.2022.106251
Gulati, R., & Kletter, D. (2005). Shrinking core, expanding periphery: The relational architecture of high‐performing organizations. California Management Review, 47(3), 77–104. https://doi.org/ https://doi.org/10.2307/41166307
Hoang, K., Doan, H.T., Tran, T.T., Nguyen, T.X., & Le, A.Q. (2022). Anti-corruption campaign and firm financial performance: Evidence from Vietnam firms. Evaluation Review, 46(2), 103-137. https://doi.org/10.1177/0193841X211072707
Hoffman, J. I. E. (2019). Analysis of variance. I. One-Way. In J. I. E. Hoffman (Ed.), Basic Biostatistics for Medical and Biomedical Practitioners (Second Edition) (pp. 391–417). Cambridge, Massachusetts: Academic Press. https://doi.org/10.1016/B978-0-12-817084-7.00025-5
Hong, J., Choi, J., Lee, J., Cho, S., Hong, T., Han, S., ... & Lee, D. E. (2023). Virtual reality-based analysis of the effect of construction noise exposure on masonry work productivity. Automation in Construction, 150, 104844.
Huang, J. Z. (1998). Functional ANOVA models for generalized regression. Journal of Multivariate Analysis, 67(1), 49–71. https://doi.org/10.1006/jmva.1998.1753
Jamaludin, M., & Yusof, Z.B. (2013). Best practice of Green Island resorts. Procedia - Social and Behavioral Sciences, 105, 20-29. https://doi.org/10.1016/j.sbspro.2013.11.003
Joyce, A., & Paquin, R. L. (2016). The triple layered business model canvas: A tool to design more sustainable business models. Journal of Cleaner Production, 135, 1474-1486. https://doi.org/10.1016/j.jclepro.2016.06.067
Knyphausen-Aufseß, D. Z., & Meinhardt, Y. (2002). Revisiting strategy: Ein Ansatz zur Systematisierung von Geschäftsmodellen. In Zukünftige geschäftsmodelle (pp. 63-89). Berlin: Springer, Berlin.
Liu, C., Bathke, A. C., & Harrar, S. W. (2011) A nonparametric version of Wilks’ lambda – Asymptotic results and small sample approximations. Statistics & Probability Letters, 81(10), 1502–1506. https://doi.org/10.1016/j.spl.2011.04.012
Lopatta, K., Böttcher, K., Lodhia, S.K., & Tideman, S.A. (2020). The relationship between gender diversity and employee representation at the board level and non-financial performance: A cross-country study. International Journal of Accounting, 55(01), 2050001. https://doi.org/10.1142/S1094406020500018
Lozano, R. (2015). A holistic perspective on corporate sustainability drivers. Corporate Social Responsibility and Environmental Management, 22(1), 32-44. https://doi.org/10.1002/csr.1325
Lüdeke-Freund, F., Bocken, N., Brent, A., Massa, L., & Musango, J. (2016). Business models for shared value: How sustainability-oriented business models contribute to business success and societal progress. Network For Business Sustainability South-Africa NBSSA Review and Synthesis Report. Retrieved from https://redd.nbs.net/s/NBS_SA_BMfSV_Executive_Guide-161128-w5jm.pdf
Lüdeke-Freund, F., Carroux, S., Joyce, A., Massa, L., & Breuer, H. (2018). The sustainable business model pattern taxonomy—45 patterns to support sustainability-oriented business model innovation. Sustainable Production and Consumption, 15, 145-162. https://doi.org/10.1016/j.spc.2018.06.004
Magretta, J. (2002). Why business models matter. Harvard Business Review, 80, 86-92.
Maji, S. G., & Saha, R. (2021). Gender diversity and financial performance in an emerging economy: Empirical evidence from India. Management Research Review, 44(12), 1660-1683. https://doi.org/10.1108/MRR-08-2020-0525
Marcoulides, G. A., & Hershberger, S. L. (2014). Multivariate statistical methods: A first course. London: Psychology Press. https://doi.org/10.4324/9781315805771
Massa, L., Tucci, C., & Afuah, A. (2017). A critical assessment of business model research. Academy of Management Annals, 11(1), 73–104. https://doi.org/10.5465/annals.2014.0072
Mensah, C. N., Long, X., Boamah, K. B., Bediako, I. A., Dauda, L., & Salman, M. (2018). The effect of innovation on CO2 emissions of OCED countries from 1990 to 2014. Environmental Science and Pollution Research, 25(29), 29678-29698. https://doi.org/10.1007/s11356-018-2968-0
Mignon, I., & Bankel, A. (2023). Sustainable business models and innovation strategies to realize them: A review of 87 empirical cases. Business Strategy and the Environment, 32(4), 1357-1372. https://doi.org/10.1002/bse.3192
Minoja, M., & Romano, G., (2021). Managing intellectual capital for sustainability: Evidence from a re-municipalized, publicly owned waste management firm. Journal of Cleaner Production, 279, 123213. https://doi.org/10.1016/j.jclepro.2020.123213
Nam, V. H., Nguyen, M. N., Nguyen, D. A., & Luu, H. N., 2020. The impact of corruption on the performance of newly established enterprises: Empirical evidence from a transition economy. Borsa Istanbul Review, 20(4), 383-395. https://doi.org/10.1016/j.bir.2020.05.006
Oghazi, P., & Mostaghel, R. (2018). Circular business model challenges and lessons learned—An industrial perspective. Sustainability, 10(3), 739. https://doi.org/10.3390/su10030739
Ojeka, S., Adegboye, A., Adegboye, K., Umukoro, O., Dahunsi, O., & Ozordi, E. (2019). Corruption perception, institutional quality and performance of listed companies in Nigeria. Heliyon 5(10), e02569. https://doi.org/10.1016/j.heliyon.2019.e02569
Osterwalder, A., & Pigneur, Y. (2010). Business model generation: a handbook for visionaries, game changers, and challengers (Vol. 1). New Jersey: John Wiley & Sons.
Oware, K. M., & Mallikarjunappa, T. (2021). Financial performance and gender diversity. The effect of family management after a decade attempt. Society and Business Review, 16(1), 94-112. https://doi.org/10.1108/SBR-05-2020-0072
Porter M. E., & Kramer M. R. (2011) The big idea: Creating shared value. Harvard Business Review, 89(1–2), 62-77.
Raben Group (2022). Raben Group Sustainability Report 2021. A Sustainable Way Forward. Raben. Retrieved from https://api.raben-group.com/fileadmin/CSR/RABEN_Sustainability_Report_2021.pdf
Rantala, T., Ukko, J., Saunila, M., & Havukainen, J. (2018). The effect of sustainability in the adoption of technological, service, and business model innovations. Journal of Cleaner Production, 172, 46-55. https://doi.org/10.1016/j.jclepro.2017.10.009
Rauter, R., Jonker, J., & Baumgartner, R. J. (2017). Going one’s own way: Drivers in developing business models for sustainability. Journal of Cleaner Production, 140, 144-154. https://doi.org/10.1016/j.jclepro.2015.04.104
Reeves, M., Haanaes, K., Love, C., & Levin, S. (2012). Sustainability as adaptability. Journal of Applied Corporate Finance, 24(2), 14-22. https://doi.org/10.1111/j.1745-6622.2012.00373.x
Richardson, J. (2008). The business model: An integrative framework for strategy execution. Strategic Change 17(5-6), 133-144. https://doi.org/10.1002/jsc.821
Richardson, J. T. E. (2011). Eta squared and partial eta squared as measures of effect size in educational research. Educational Research Review, 6(2), 135–147. https://doi.org/10.1016/j.edurev.2010.12.001
Rosner, B., & Grove, D. (1999). Use of the Mann–Whitney U-test for clustered data. Statistics in Medicine, 18(11), 1387–1400. https://doi.org/10.1002/(SICI)1097-0258(19990615)18:11<1387::AID-SIM126>3.0.CO;2-V
Ruxton, G. D., & Beauchamp, G. (2008). Some suggestions about appropriate use of the Kruskal–Wallis test. Animal Behaviour, 76(3), 1083–1087. https://doi.org/10.1016/j.anbehav.2008.04.011
Schroedel, S. (2023). The sustainable business model database: 92 patterns that enable sustainability in business model innovation. Sustainability, 15(10), 8081. https://doi.org/10.3390/su15108081
Shakeel, J., Mardani, A., Chofreh, A. G., Goni, F. A., & Klemeš, J. J. (2020). Anatomy of sustainable business model innovation. Journal of Cleaner production, 261, 121201. https://doi.org/10.1016/j.jclepro.2020.121201
Stoughton, A. M., & Ludema, J. (2012). The driving forces of sustainability. Journal of Organizational Change Management 25(4), 501-517.
Su, H.-N., & Moaniba, I. M., (2017). Does innovation respond to climate change? Empirical evidence from patents and greenhouse gas emissions. Technological Forecasting and Social Change, 122, 49-62. https://doi.org/10.1016/j.techfore.2017.04.017
Suchecki, B., & Lewandowska-Gwarda, K. (2010). Klasyfikacja, wizualizacja i grupowanie danych przestrzennych. In B. Suchecki, (Ed.), Ekonometria przestrzenna. Metody i modele analizy danych przestrzennych. Warsaw: C.H. Beck.
Teece, D.J. (2010). Business models, business strategy and innovation. Long Range Planning, 43(2-3), 172-194. https://doi.org/10.1016/j.lrp.2009.07.003
Van Vu, H., Tran, T.Q., Van Nguyen, T., & Lim, S. (2018). Corruption, types of corruption and firm financial performance: New evidence from a transitional economy. Journal of Business Ethics, 148, 847–858. https://doi.org/10.1007/s10551-016-3016-y
Velte, P. (2017). Does ESG performance have an impact on financial performance? Evidence from Germany. Journal of Global Responsibility, 8(2), 169-178. https://doi.org/10.1108/JGR-11-2016-0029
Wang, X., Orelaja, O. A., Ibrahim, D. S., & Ogbonna, S. M. (2020). Evaluation of noise risk level and its consequences on technical operators of tobacco processing equipment in a cigarette producing company in Nigeria. Scientific African, 8, e00344. https://doi.org/10.1016/j.sciaf.2020.e00344
Wirtz, B. W., Pistoia, A., Ullrich, S., & Gottel, V. (2016). Business models: origin, development and future research perspectives. Long Range Planning, 49(1), 36-54. https:// doi.org/10.1016/j.lrp.2015.04.001
Wolf, J. (2014). The relationship between sustainable supply chain management, stakeholder pressure and corporate sustainability performance. Journal of Business Ethics, 119, 317-328. https://doi.org/10.1007/s10551-012-1603-0
Yang, M., Evans, S., Vladimirova, D., & Rana, P. (2017). Value uncaptured perspective for sustainable business model innovation. Journal of Cleaner Production, 140, 1794-1804. https://doi.org/10.1016/j.jclepro.2016.07.102
Zott, C., & Amit, R. (2010). Business model design: An activity system perspective. Long Range Planning, 43(2-3), 216-226. https://doi.org/10.1016/j.lrp.2009.07.004
Zufall, J., Norris, S., Schaltegger, S., Revellio, F., & Hansen, E. G. (2020). Business model patterns of sustainability pioneers: Analyzing cases across the smartphone life cycle. Journal of Cleaner Production, 244, 118651. https://doi.org/10.1016/j.jclepro.2019.118651
Supplementary materials
Supplementary material 1. Robust tests of equality of means for model of dependence of ESG goals on the financial condition of enterprises
|
Variable |
Robust test |
Statistica |
df1 |
df2 |
Sig. |
|
Gender employment gap |
Welch |
154.988 |
1 |
4185.599 |
<.001 |
|
Brown-Forsythe |
154.988 |
1 |
4185.599 |
<.001 |
|
|
Final energy consumption |
Welch |
0.117 |
1 |
4599.784 |
0.732 |
|
Brown-Forsythe |
0.117 |
1 |
4599.784 |
0.732 |
|
|
Total population living in households considering that they suffer from noise |
Welch |
20.425 |
1 |
4644.126 |
<.001 |
|
Brown-Forsythe |
20.425 |
1 |
4644.126 |
<.001 |
|
|
Greenhouse gas emissions |
Welch |
176.661 |
1 |
5198.459 |
<.001 |
|
Brown-Forsythe |
176.661 |
1 |
5198.459 |
<.001 |
|
|
Corruption Perceptions Index |
Welch |
83.812 |
1 |
4488.372 |
<.001 |
|
Brown-Forsythe |
83.812 |
1 |
4488.372 |
<.001 |
Note: a. Asymptotically F distributed. Results that are not statistically significant are marked by underlines.
Source: Own elaboration based on data from the BACH and Eurostat databases.
Supplementary material 2. Robust tests of equality of means for sub-model of dependence of ESG goals on the financial condition of enterprises with dividing the research period into sub-periods (2008-2014 and 2015-2020)
|
Variable |
Robust test |
Statistica |
df1 |
df2 |
Sig. |
|
Gender employment gap |
Welch |
107.501 |
3 |
2976.594 |
<.001 |
|
Brown-Forsythe |
108.400 |
3 |
5147.873 |
<.001 |
|
|
Final energy consumption |
Welch |
6.605 |
3 |
3068.972 |
<.001 |
|
Brown-Forsythe |
6.579 |
3 |
5718.045 |
<.001 |
|
|
Total population living in households considering that they suffer from noise |
Welch |
171.276 |
3 |
3028.941 |
<.001 |
|
Brown-Forsythe |
177.152 |
3 |
5344.205 |
<.001 |
|
|
Greenhouse gas emissions |
Welch |
122.123 |
3 |
3181.883 |
<.001 |
|
Brown-Forsythe |
122.776 |
3 |
6304.179 |
<.001 |
|
|
Corruption Perceptions Index |
Welch |
61.814 |
3 |
3054.278 |
<.001 |
|
Brown-Forsythe |
63.231 |
3 |
5537.427 |
<.001 |
Note: a. Asymptotically F distributed.
Source: Own elaboration based on data from the BACH and Eurostat databases.
Abstrakt
CEL: Wpływ czynników ESG na wyniki finansowe został potwierdzony w literaturze przedmiotu. Celem artykułu jest zbadanie zależności między czynnikami finansowymi i niefinansowymi w przedsiębiorstwach oraz wskazanie, dla których grup przedsiębiorstw relacja wyników finansowych ESG jest najbardziej widoczna w kontekście budowania zrównoważonych modeli biznesowych i zdolności do adaptacji do zrównoważonego rozwoju. W artykule założono, że wyniki finansowe i niefinansowe przedsiębiorstw determinują ich zdolność adaptacji do zrównoważonego rozwoju, oraz że istnieje związek między wynikami finansowymi, wynikami niefinansowymi i zrównoważonymi modelami biznesowymi przedsiębiorstw. METODYKA: Analiza obejmuje 12 krajów UE w latach 2008–2020. W badaniu przeanalizowano 6 864 obserwacje, czyli 96 096 komórek danych. Dane podzielono na dwie grupy zmiennych: finansowe i niefinansowe. Badania opierają się na analizie klastrów i ANOVA. Przeprowadzono je w dwóch etapach. W pierwszym etapie przedsiębiorstwa zostały pogrupowane w klastry według kryterium kondycji finansowej, biorąc pod uwagę wielkość przedsiębiorstwa, sektor i kraj, w którym prowadzi działalność. W kolejnym kroku sprawdzono, czy przedsiębiorstwa o dobrej sytuacji finansowej osiągają również lepsze wyniki pozafinansowe. WYNIKI: Badanie pokazało, że w odniesieniu do danej branży oraz kraju prowadzenia działalności, duże przedsiębiorstwa osiągają lepsze wyniki finansowe niż małe i średnie firmy. Można podkreślić, że istnieją istotne statystyczne różnice pomiędzy podmiotami o relatywnie dobrej sytuacji finansowej a tymi o relatywnie słabej sytuacji finansowymi w kontekście takich wartości jak zróżnicowanie poziomu zatrudnienia ze względu na płeć, odsetek gospodarstwach domowych odczuwających w odniesieniu do swojego miejsca zamieszkania nadmierny hałas, emisja gazów cieplarnianych, Indeks Percepcji Korupcji. Przedsiębiorstwa o relatywnie lepszej sytuacji finansowej charakteryzują się mniejszym zróżnicowaniem poziomu zatrudnienia ze względu na płeć (na poziomie krajowym) niż podmioty o relatywnie gorszej kondycji finansowej. Podobny wynik otrzymano w odniesieniu do poziomu emisji gazów cieplarnianych. IMPLIKACJE: Wyniki tego badania mogą być przydatne dla zarządów firm w opracowywaniu strategii transformacji w kierunku zrównoważonego rozwoju, dzięki temu, że dostarczają informacji o tym, jakie czynniki należy uwzględnić w procesie transformacji. ORYGINALNOŚĆ I WARTOŚĆ: Oryginalność tego opracowania polega na tym, że uwzględnia ono zarówno czynniki finansowe, jak i niefinansowe oraz bada związki między tymi czynnikami w procesie adaptacji przedsiębiorstw w kierunku zrównoważonego rozwoju i zrównoważonego modelu biznesowego.
Słowa kluczowe: zrównoważone modele biznesowe, ESG, wyniki finansowe, ryzyko, zrównoważony rozwój, adaptacja, przedsiębiorstwa, czynniki finansowe, czynniki pozafinansowe
Magdalena Zioło is Professor at University of Szczecin, Poland. Her research and teaching scope focus on finance, banking and sustainability. She has extensive experience gained in financial institutions. She has received scholarships from the Dekaban-Liddle Foundation (University of Glasgow, Scotland) and Impakt Asia Erasmus + (Ulan Bator, Mongolia). She is a Member of Polish Accreditation Commission, Member of the Financial Sciences Committee of PAS (the Polish Academy of Sciences), Member of the Advisory Scientific Committee of the Financial Ombudsman, Expert of the National Centre for Research and Development, Expert of the National Science Centre and the National Agency for Academic Exchange, Expert of the Accreditation Agency of Curacao. She was a member of State Quality Council, Kosovo Accreditation Agency and visiting professor at University of Prishtina (Kosovo). She is Principal Investigator in the research projects funded by National Science Center, Poland in the field of sustainable finance. She is the author and editor of numerous books, mostly about financing sustainable development.
Elżbieta Szaruga is employed at the University of Szczecin as an Assistant Professor at the Department of Transport Management (Institute of Management). She specializes in Data Science, transport economics, and energy economics. Author of numerous publications on sustainable development and sustainable transport, especially the energy intensity of transport and Data Science. Reviewer in prestigious international journals. Laureate of international competitions (e.g., European Friedrich List Prize for young scientists in European Transport Sciences; 2022 Outstanding Reviewer Award). Expert in numerous research teams. Member of the European Economic Association.
Anna Spoz is an Assistant Professor at the Department of Finance and Accountancy at the John Paul II Catholic University of Lublin, Poland. Her research and teaching scope focus on finance, particularly corporate finance, accounting and tax, and sustainable finance. Author and co-author of numerous publications on finance, accounting, reporting, and management. She is a reviewer of international publications and she combines teaching and scholarly activities with work in business.
Authorship contribution statement
Magdalena Zioło: Conceptualization, Methodology, Writing – Original Draft Preparation, Writing – Review and Editing, Project Administration, Supervision. Elżbieta Szaruga: Methodology, Data Curation, Validation, Software, Writing – Original Draft Preparation, Writing – Review and Editing. Anna Spoz: Resources, Writing – Original Draft Preparation, Writing – Review and Editing, Supervision, Revisions.
Conflicts of interest
The authors declare no conflict of interest.
Citation (APA Style)
Zioło, M., Szaruga, E., & Spoz, A. (2023). Financial and non–financial factors in companies’ adaptation process towards sustainability and sustainable business models. Journal of Entrepreneurship, Management, and Innovation, 19(4), 48-82. https://doi.org/10.7341/20231942