Dr Nicholas J Milton, Director, Knoco ltd. Rose Cottage, Burnett, Keynsham, Bristol, UK BS31 2TE. +44 7803 592947. Email: This email address is being protected from spambots. You need JavaScript enabled to view it..
Abstract
Data collected through an online survey and through a number of detailed company assessments throw light on the relative strengths and weaknesses of different elements of Knowledge Management (KM) frameworks as applied globally. The online survey - a quick self-administered test, shows the strongest elements within the framework to be Technology and Behaviors and Culture. The weakest elements are KM Governance and KM Roles. The assessment - a detailed diagnostic process based on in-depth interviews, shows the strongest elements within the framework to be Technology and the Discussion of Knowledge. The weakest elements are KM Governance and KM Roles. a comparison of the results from the two sources is reassuringly close. More data may allow a more detailed analysis. Preliminary results suggest that national culture may influence the development of Knowledge Management Frameworks, with a correlation between strong Individuality and weak KM Governance and Roles.
Keywords: Knowledge Management Survey, Knowledge Management Assessment, Knowledge Management Benchmark, Knowledge Management Framework, Knowledge Management Roles, Knowledge Management Technology, Knowledge Management Governance.
Introduction
Research, albeit often unstructured, is part and parcel of the knowledge management practitioner’s life, particularly for knowledge management consultants. Every engagement with a client is an experiment and a data point. The consultant is constantly looking for evidence and information on approaches to knowledge management, successful and unsuccessful alike. He or she needs to know what succeeds in knowledge management terms and what fails, in order to be able to transfer that knowledge to future clients. An effective knowledge management consultancy that has operated successfully for many years therefore has built up a body of empirical knowledge which may be extremely useful.
Seldom is that knowledge shared. It is treated as competitive advantage: guarded by secrecy and non disclosure agreements. Also, unlike academic research, there may be no hypothesis to be tested, and no consistent data set to be interrogated. The dataset remains empirical and unstructured.
The case study presented in this chapter is an example of data and experience collected over a number of years, but is unusual in having been built around systematic data collection from a number of clients. One of the services that the author’s company provides to organizations is an assessment and benchmarking service. This is provided in two forms: a free online selfbenchmark survey, and a detailed interview-based analysis the organizational frameworks applied to knowledge management. Enough data have been collected now from these two forms of survey to draw some tentative conclusions about strengths and weaknesses in knowledge management.
This is not an academic study, but an empirical study based on practical experience, presented in a descriptive way. The study includes no literature survey, no research methodology, and no statistical testing. The results should therefore be taken as empirical results; hopefully interesting for practitioners and serving as an insight to researchers.
Survey methods
Survey data on the completeness of organizational knowledge management frameworks has been collected in two ways.
Firstly, a number of on-line knowledge management surveys are available at http://www.knoco.com.au/surveys/. One of these is a survey of knowledge management maturity, which looks at the development levels of several of the key components of a knowledge management framework. Participants were invited to take part in the survey through messages on Linked-In, and through a regular Knowledge Management newsletter sent to a sign-up mailing list of over 3000 people. Data were collected over the period from December 2012 to March 2104.
The survey rates KM maturity against 10 elements, assigning marks from 1 to 5 as participants select one from a number of statements for describing different maturity or development levels. The 10 elements are listed below, and the five statements for each element which describe the maturity levels are shown in Table 1:
- Learning Before
- Learning During
- Learning After
- Communities of practice (CoPs)
- Ownership of Knowledge (k ownership)
- KM roles
- KM technologies
- Behavior and culture
- Governance
- Business alignment
In addition to the maturity data, the survey also records the geography and the industry segment of the organization which the respondent is describing. To date, 248 responses to this survey have been received over a period of 16 months.
Secondly, the author’s company has, for the past decade, offered an assessment service for clients. This is a detailed diagnostic assessment of the current status of the knowledge management framework within the client organization, which allows it to be benchmarked against knowledge management peers. Currently we have assessment data from over 50 assessments, each one representing an organization, or a team, department or division within an organization. Each of these assessments is covered by confidentiality agreements, so the name of the companies involved, the results of individual surveys or comments from interviewed staff cannot be published.
The Assessment model is based on assessing the effectiveness of the flow of knowledge from one person, team, department or project to another, and the assessment framework is a combination of two basic Knowledge Management models:
- a model derived from the SECI model of Nonaka and Takeuchi (1995), which considers the four transitions of knowledge:
- The transfer of knowledge from tacit to tacit states, through Discussion
- The transfer of knowledge from tacit or explicit state, through Capture
- The transfer and refinement of knowledge within the explicit state, through Synthesis
- The transfer of knowledge from explicit to tacit state, through access and re-use.
- a model of four enablers for knowledge management:
- People (roles and accountabilities)
- Processes
- Technology
- Governance, including clarity of expectation, performance management and support.
| Column1 | Score 1 | Score 2 | Score 3 | Score 4 | Score 5 |
|---|---|---|---|---|---|
| Learning Before | Learning before’ never occurs. All new pieces of work are based on what the relevant staff already know | Learning before’ is rare. Only a few projects or pieces of work will learn from others before they start | Learning before’ happens some of the time. It is neither unknown behavior, nor is it routine or expected. It occurs on an ad-hoc basis, or locally within the firm. | Learning from others before you start’ is accepted behavior for most pieces of work. It is however not required behavior, nor is there the requirement to act on the knowledge received. | Learning from others before you start’ is part of required business process and occurs as routine for all significant projects or new pieces of work. Any knowledge so acquired is acted upon. |
| Learning During | Learning during’ never occurs. Teams talk about delivery and challenge, but never about learning or knowledge. | Learning during’ is rare. Only a very few managers and team leaders discuss what a team is learning. | Learning during’ occurs locally within the organization, being applied at certain levels and not at others, or for certain tasks. | Learning during’ is accepted behavior for most pieces of work, and is practiced at most levels, but is not applied routinely, or is not embedded into business process. | Learning during’ is part of required business process and occurs by default in all projects, at all levels. Any knowledge discussed in the team is acted upon, and forward plans updated as a result. |
| Learning After | Learning after’ never occurs. Any reviews of delivery, performance or projects have no element of knowledge capture. | Learning after’ is rare, and relies on the enthusiasm of the project leader or team leader. Results are often not easy to find or not easy to use. | Learning after’ either occurs locally within the firm, being applied at certain levels and not at others, or is widespread but gives results which are far from ideal from the point of view of reuse of knowledge. | Learning after’ is accepted behavior for most pieces of work, and is practiced at most levels with reasonably good quality results, but there is room for improvement. | Learning after’ is part of required business process and occurs by default in all projects, at all levels. The process is an effective one, and the output is good quality lessons and actions which will improve the way work is done in future. |
| Communities of practice (CoPs) | There is no sharing of knowledge through practitioner networks. | Communities of practice’ and knowledge-sharing networks are rare. Either networking is not a standard business process, or the majority of networks do not function as knowledgesharing mechanisms. | Either ‚Communities of practice’ or knowledgesharing networks are in place for some business activities, or else there are many networks but the delivery of value through these networks is questionable. | Communities of practice’ are accepted mechanisms for knowledge sharing for many key business activities, but by no means all. | Communities of practice’ exist and are maintained, monitored, facilitated, and actively used, for all key business activities at all levels, and add real value through problem-solving and sharing best practices |
| Ownership of Knowledge (kownership) | None of the companies key knowledge is stored or available for future re-use. | Key knowledge has been collated and made available for a small proportion of business activity, but may not be clearly owned or updated. | Collections and summaries of key knowledge have been created and are owned on an ad-hoc basis for some business activities. Re-use of this knowledge is variable. | Collections and summaries of key knowledge, guidance and best practices exist for most key business activities, but by no means all, or else are not routinely updated. | Collections and summaries of key knowledge, guidance and best practices are in place and are maintained, owned, updated (by or on behalf of the communities of practice), and actively used, for all key business activities in the organization. |
| KM roles | There are no defined knowledge-related roles, and no assigned knowledge accountabilities in the organization. | Explicit knowledge roles are rare in the organization. Few business units or functions have defined accountability for knowledge. | Some Knowledge roles are developed within the company (for example CoP leaders, CoP facilitators, Process owners, KM champions). | Many or most business units have somebody with a defined accountability for knowledge management, many or most CoPs have a leader/ facilitator, many or most key processes or practices have a dedicated Subject Matter Expert. | Knowledge roles are established in all business units, in all communities of practice, and for all areas of critical company knowledge. There are one or more support teams for knowledge-related accountabilities. |
| KM technologies | There is no technology available for communicating or sharing knowledge with others, or for finding stored knowledge. | Some limited technology infrastructure exists, such as search engine and email, but nothing for effective collaboration, networking or sharing. | There is a general infrastructure of supportive technologies, covering search, collaboration and knowledge organization, but it is by no means easy or possible to share or find knowledge across the entire company. | The technology infrastructure largely supports KM, within reasonable Web 2.0 functionality, but some barriers still exist for effective networking, publishing and finding published knowledge, or finding knowledgeable people. | A full suite of high-quality technology exists for all staff to communicate and network company wide, to freely share and store written and recorded knowledge, and to easily find stored knowledge and knowledgeable people and networks |
| Behavior and culture | The behaviors and the attitudes of the management and employees are opposed to the free sharing of knowledge. There is rivalry and internal competition within the organization. | There are some rare people who are open to sharing and reusing knowledge across the organization. However the default behavior is still hoarding, internal competition and reinvention of solutions. | Knowledge sharing and learning from others is neutral behavior. It is neither seen as desirable nor undesirable. It occurs in some areas of the organization, but not others. | There is a general freedom in the sharing of knowledge throughout the organization although some pockets of resistance remain and by no means is everybody open to sharing and receiving knowledge. | The behaviors and the attitudes of the employees are entirely conducive to the free sharing of knowledge. Knowledge sharing and learning from others is „the way we work in this organization” |
| Governance | There is no link between knowledge management and reward/recognition, and no formal or informal expectations for knowledge management activity or behaviors | There are some isolated attempts to performance-manage KM, such as awards nor articles in internal communications, but these are rare. | Some aspects of Knowledge Management are embedded into corporate process, and so have become expected behavior. | Knowledge management is fully embedded into corporate process. In some cases there is a link between KM expectations and reward and recognition. | Knowledge management expectations are clear to everyone. KM performance is measured, and KM behavior is rewarded as part of normal rewards and recognition. |
| Business alignment | Knowledge management is treated entirely separately from the normal activities of the business. | Generally the knowledge management activities of the company are not linked to business priorities, with a some exceptions | Knowledge management is loosely linked to business processes, business targets and business needs. Some business areas or projects have defined Critical Knowledge Areas, which they manage proactively. | Knowledge management is generally linked to business needs, many or most units and projects have defined their critical knowledge areas, and many or most areas of company-strategic knowledge are owned and managed (e.g. by communities of practice) | Knowledge is treated as a key operational and strategic resource. Most or all departments and projects focus on knowledge critical to them, and all areas of strategic knowledge are proactively managed (e.g. through networks, communities, and/or practice owners). |
| Source: Available online at http://www.knoco.com/knowledge-management-downloads.htm. | |||||
The effectiveness and completeness of the Knowledge Management framework and the client organizations is therefore measured against 15 elements, shown in Figure 1:

The presence and performance of each of these elements within the client organizations is determined through structured in-depth diagnostic interviews of a range of staff. The interviews, which last approximately an hour, take each interviewee through open and closed questions around culture, people, process and technology facets of KM, using a standard protocol. The interview may be performed face-to-face, or by telephone if face-to-face is impossible.
The current status of each of the 15 points as described in each interview is given a mark out of 5, depending on the level of completeness of that element, as follows:
- this element is completely absent or ineffective,
- this element is slightly addressed,
- this element is partly present with significant room for improvement,
- this element is largely present with some room for improvement,
- this element is fully in place.
The results of the assessment are reported back to the client, together with a comparison against the best in class, and a list of all of the possible interventions to complete the clients knowledge management framework. By “best in class” we mean organizations with a long history in Knowledge Management, a published record in delivering business results through Knowledge Management, and consistent recognition in schemes such as the Most Admired Knowledge Enterprise awards1. In addition to this clienttailored report, the number of repeat assessments allows a comparison across multiple organizations to look at patterns of poorly developed and well developed Knowledge management elements.
Analysis and study
The following results from the survey and from the assessment are presented for discussion. The demographics of the online survey participants are presented below in Tables 1 and 2. Please note, the survey allows participants to describe themselves as researchers (people who are visiting the survey out of interest, rather than to benchmark their organization), though providing a tick-box labeled “I am a KM Consultant / Student/ Researcher and the results should NOT be used in Benchmarking”. These results have been removed from the dataset described in Tables 1 and 2 and shown in Figures 2, 3 and 7, leaving 149 responses which are believed to represent reliable data
| Country | Number of responses |
|---|---|
| Algeria | 1 |
| American Samoa | 1 |
| Angola | 1 |
| Argentina | 2 |
| Australia | 22 |
| Azerbaijan | 4 |
| Belgium | 12 |
| Canada | 9 |
| Chile | 1 |
| China | 3 |
| Denmark | 4 |
| Ethiopia | 1 |
| France | 3 |
| Germany | 1 |
| India | 4 |
| Indonesia | 1 |
| Jordan | 1 |
| Kuwait | 1 |
| Latvia | 1 |
| Luxembourg | 1 |
| Malaysia | 3 |
| New Zealand | 1 |
| Norway | 1 |
| Portugal | 1 |
| Saudi Arabia | 1 |
| South Africa | 4 |
| Sweden | 5 |
| Switzerland | 1 |
| Thailand | 1 |
| UAE | 2 |
| UK | 18 |
| US | 23 |
| Multinational or unknown | 13 |
| Industry sector | Number of responses |
|---|---|
| Agriculture, forestry and fishing | 5 |
| Construction | 5 |
| Education and Training | 11 |
| Electricity, Water and Waste | 8 |
| Financial and Insurance Services | 9 |
| Health care and social assistance | 4 |
| Information, media and telecoms | 10 |
| Manufacturing | 5 |
| Mining, oil and gas | 32 |
| Other services | 9 |
| Professional, scientific and technical | 24 |
| Public administration and safety - defense | 15 |
| Retail trade | 1 |
| Transport, postal and warehousing | 1 |
| Multi-industry or unknown | 10 |
The average scores (between 1 and 5) for the different elements of Knowledge Management measured by the online survey are shown in Figure 2, where 5 is a high level of maturity, and 1 is a low level.
The following observations can be made:
- Average scores are moderate to low. Although some individual responses include scores as high as 5 for some elements, and some scores as low as 1, the data-set taken as a whole suggests that Knowledge Management is not yet a fully mature discipline.
- The highest score is for Technology, by a significant margin.
- The second highest score is for culture and behaviors. Culture, long considered to be the biggest barrier to Knowledge Management, no longer seems to be the biggest issue.
- The lowest score, by a very long way, is for Governance.
- The second lowest is for Roles.
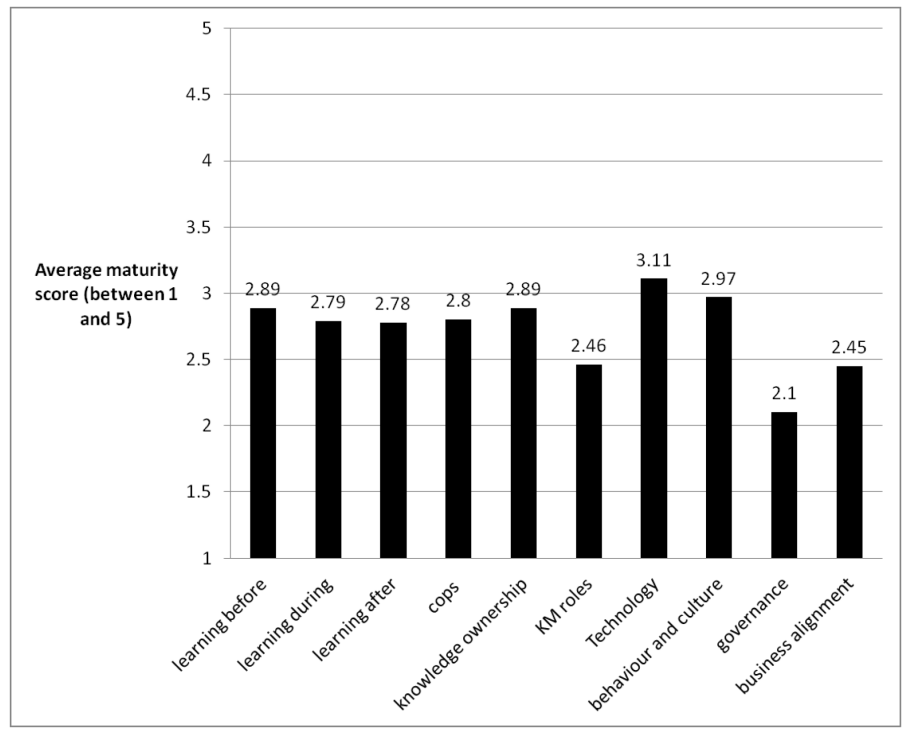
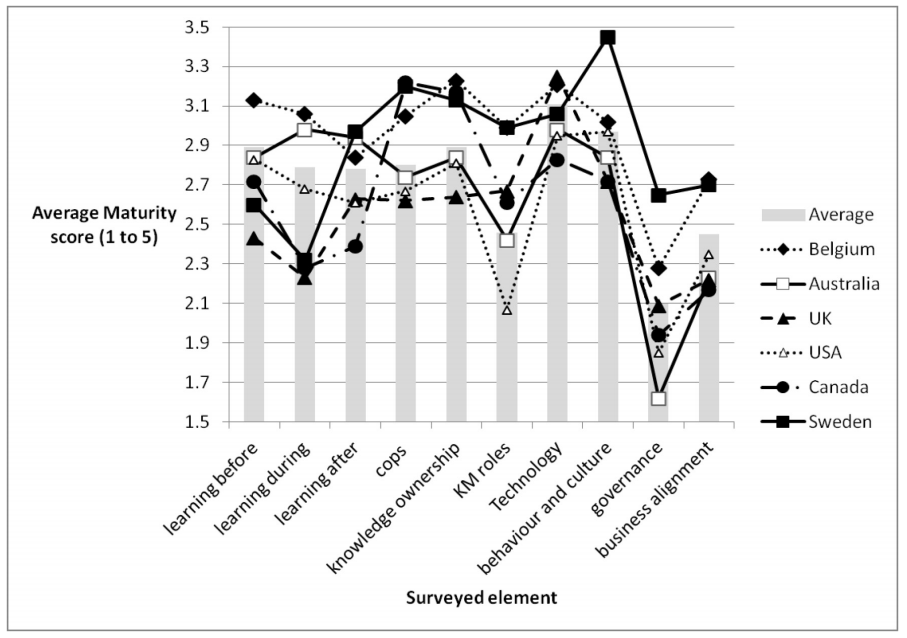
Figure 3 shows the results for six countries - those 7 where we have 5 or more entries to the survey/ The overall KM Maturity scores for these countries are in the following order, from highest to lowest:
- Belgium
- Sweden
- Australia
- Canada
- USA
- UK
All 6 countries see the same dip on the graph related to KM governance and business alignment, and USA, Canada and Australia see a similar dip on KM roles.
The demographics for the Assessment are shown below in Tables 4 and 5.
| Country | Number of Assessments with the country sample set |
|---|---|
| Angola | 1 |
| Argentina | 1 |
| Australia | 2 |
| Azerbaijan | 4 |
| Belgium | 2 |
| Brazil | 1 |
| Canada | 1 |
| Chile | 1 |
| Kuwait | 1 |
| Malaysia | 1 |
| Norway | 1 |
| Oman | 1 |
| Saudi Arabia | 1 |
| South Africa | 2 |
| Sweden | 5 |
| Thailand | 1 |
| UAE | 2 |
| UK | 10 |
| US | 2 |
| Multinational | 18 |
| Industry sector | Number of responses |
|---|---|
| Construction | 2 |
| Education and Training | 1 |
| Electricity, Water and Waste | 2 |
| Financial and Insurance Services | 1 |
| Manufacturing | 9 |
| Mining, oil and gas | 30 |
| Professional, scientific and technical | 1 |
| Public administration and safety - defense | 6 |
The average results for the 15 components of Knowledge Management measured by the Assessments are shown in Figure 4.
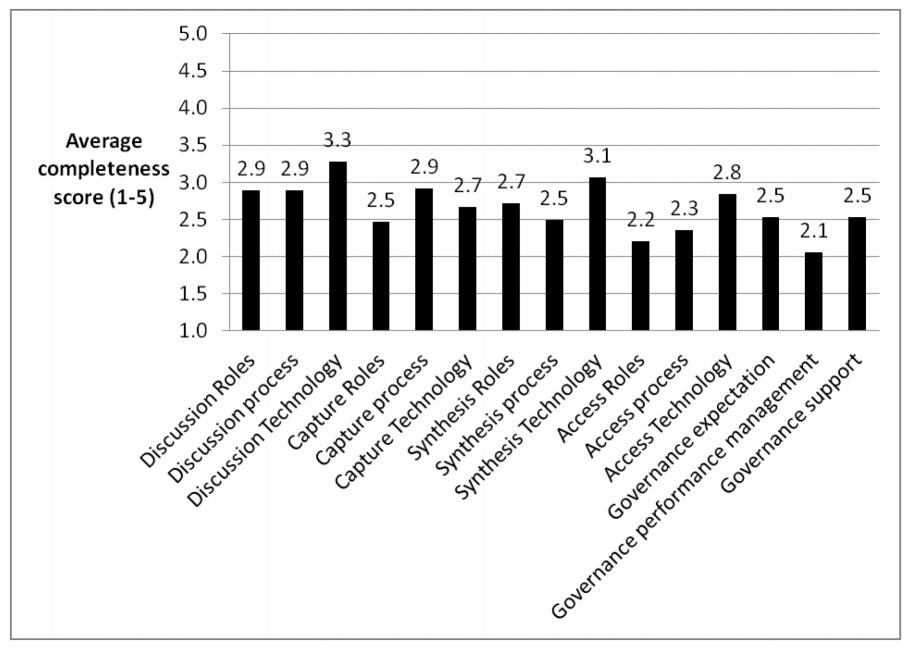
The following observations can be made:
- As previously, the average scores are moderate to low. Although some individual responses include scores as high as 5 for some elements, and some scores as low as 1, the data-set taken as a whole suggests that Knowledge Management is not yet a mature discipline.
- The highest scores are for Discussion Technology and Synthesis Technology.
- The lowest score is for the Performance Management element of Governance.
These 15 elements can be grouped into the four transitions of knowledge described above as based on the four quadrants of the SECI model, and also into the four enablers mentioned above. The results of these groupings are shown in Figures 5 and 6.
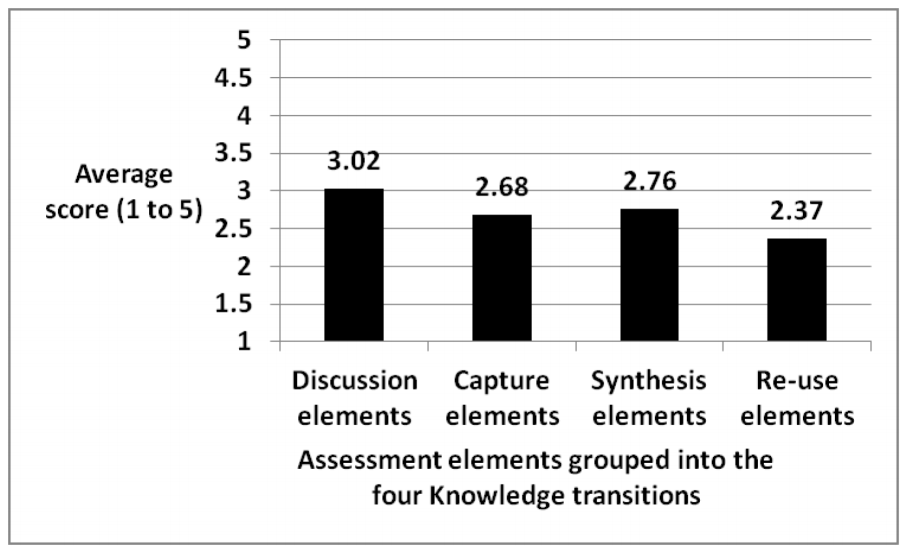
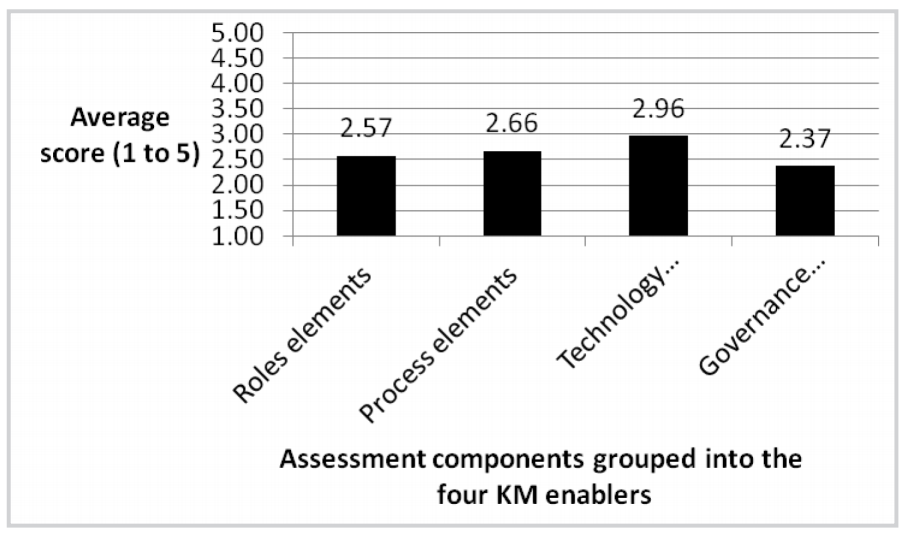
These figures illustrate two more points;
- The discussion transition (tacit to tacit) is on average the strongest, with roles, technologies and processes most often in place. The weakest transition is knowledge Access and re-use (explicit to tacit).
- The Technology enabler is the strongest of the four, with Governance being the weakest and Roles the second weakest.
There is some equivalence in content between the Online Survey and the Assessment, as shown in table 6 below.
| Discussion Roles | CoPs |
| Discussion process | CoPs |
| Discussion Technology | Technology |
| Capture Roles | KM roles |
| Capture process | Learning Afte |
| Capture Technology | Technology |
| Synthesis Roles | Knowledge Ownership |
| Synthesis process | |
| Synthesis Technology | Technology |
| Access Roles | KM Roles |
| Access process | Learning Before |
| Access Technology | Technology |
| Governance expectation | |
| Governance performance management | Governance |
| Governance support |
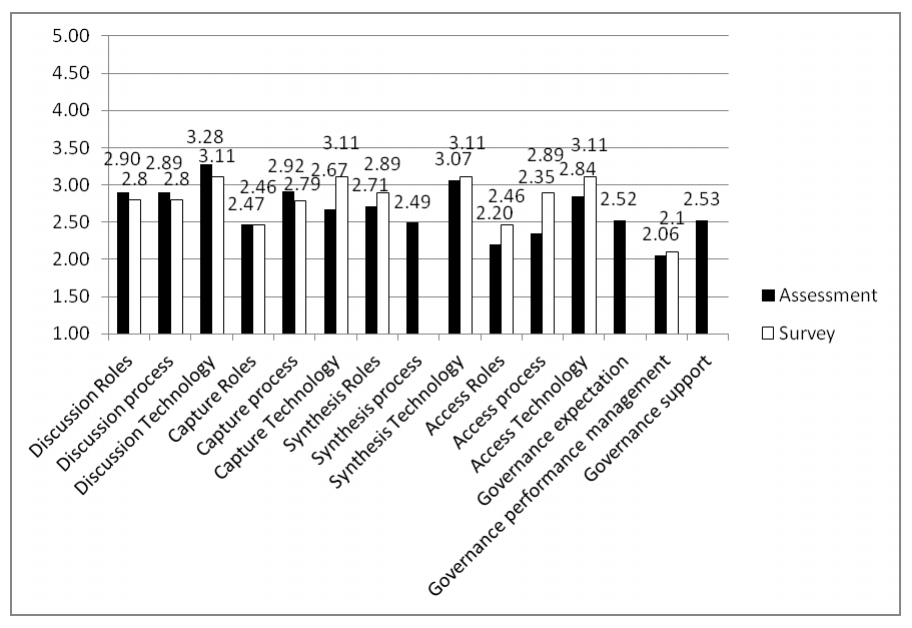
This equivalence therefore allows data from the two datasets to be directly compared, as shown in Figure 7 below.
Discussion
The results from Figure 7 suggest that the Survey and the Assessment are measuring the same things in a similar way, despite very different datagathering methods. Scores are similar, and trends within the scores are similar. This similarity reinforces the assumption that the data are real, and reflect the reality of Knowledge Management initiatives.
The main conclusions to draw from the data at this stage are as follows:
- Firstly, technology is a relative strength in the Knowledge management approaches applied to date(Figures 5 and 2).
- Secondly, the Discussion of Knowledge is a relative strength (Figure 5) reflecting the popularity of Communities of Practice, and the availability of Social technologies.
- Thirdly, the greatest weakness in all the data-sets is Knowledge Management Governance - the leadership and support structures that provide the reason and the reward for doing Knowledge Management. This is clear in Figure 2 and Figure 6, and further illuminated in Figure 7, where the lowest scoring, and therefore least effective, element of KM is Performance Management. This element represents the way that Knowledge Management is measured and rewarded, and is one of the elements that drive the behaviors and cultures.
- Fourthly, both Figure 6 and Figure 2 point out the weakness of the Knowledge Roles element.
- Fifthly, the weakest of all the Knowledge Management transitions is Knowledge re-use - the transition from documented knowledge to “knowledge in action” – i.e. knowledge in people’s heads and consciousness which helps them make the correct decisions.
With more assessments and surveys over time, we might be able to interrogate the data more finely, and speculate on why some effects have been observed.
The correlation between the assessment and the strategy suggest some level of empirical support for the utility of the SECI model of Nonaka and Takeuchi. This model forms one dimension of the Assessment matrix shown as Figure 1, and the independent corroboration of the survey results with the Assessment results suggests that the this model may have utility as a way of analyzing the components of a Knowledge Management Framework.
The strengths and weaknesses identified through the data may be used to infer potential areas for organizations to address as part of Knowledge Management implementation. If companies wish to improve beyond their current maturity level or framework completeness, then acquiring more and better technology should perhaps not be the primary focus, as Technology seems seldom to be the weakest element. There are many other, much weaker elements which will need to be addressed before Knowledge Management will add value.
Governance is a crucial element that seems to be a generic weakness, and without there is no organizational drive towards doing KM, and KM remains an unmeasured, unrewarded optional component. Similarly without clear roles and accountabilities (another common weakness) nobody is clear what they are supposed to do in Knowledge Management terms, which often results in jobs not getting done, and people waiting for others to take the lead. Finally Knowledge re-use is a common weakness which many organizations may need to address, as any efforts in knowledge capture and synthesis are wasted effort if that knowledge does not get re-used.
The availability of international datasets such as these, collected by practitioners over a number of years, offers a valuable opportunity for research. Research programs to date tend to be case-based; rigorous shortterm in-depth investigations - often survey-based - with the aim of answering specific questions. Consultant practitioners on the other hand collect data on a very long term basis, across multiple organizations, sectors and countries, although seldom testing hypotheses from the data with academic rigor. There is surely an opportunity for collaboration between research and practice to make better use of practitioner datasets.
Perhaps the most valuable fruits of this collaboration might lie in the ability to test more systematically some of the models and heuristics being applied by practitioners. Experienced Knowledge Management practitioners “know” what works, but this knowledge is often empirical practical knowledge with no sound basis in theory. Models such as SECI have proven valuable in explaining Knowledge Management, and in developing frameworks such as shown in Figure 1, to categorize and assess Knowledge Management in action. The data presented here provides a cross-check on that framework and seems to support its validity or utility, and further studies would be welcome to provide testing and a theoretic underpinning for practitioner heuristics.
Conclusion
Data gathering over many years on the strengths and weaknesses of elements of a Knowledge Management framework have allowed these to be aggregated and compared. Technology seems to be the strongest most mature factor in Knowledge Management programs worldwide, and of the four Knowledge Transitions, the strongest is Tacit to Tacit discussion (roughly equivalent to the Socialization element of Nonaka and Takeuchi, 1995). The weakest elements are Governance and Knowledge Management roles, and the weakest of the four Knowledge Transitions is Access and Re-use (roughly equivalent to the Internalization element of Nonaka and Takeuchi, 1995). Datasets such as these suggest a potential avenue for collaboration between practitioners (rich in data, but untrained in academic rigor) and academia (with rigor, but often short of data).
References
- Hofstede, G., Hofstede, G. J., & Minkov, M. (2010). Cultures and Organizations: Software of the Mind. 3rd Edition. USA. McGraw-Hill.
- Nonaka, I. & Takeuchi, H. (1995). The knowledge-creating company. New York: Oxford University Press.
Biography
Dr. Nick Milton is director and co-founder of Knoco Ltd, with 22 years history working in Knowledge Management. Working with Knoco Ltd, Nick has been helped develop and deliver KM strategies, implementation plans and services in a wide range of different organizations around the globe. He has a particular interest in Lessons Learned programs, and has managed major lessons capture programs, particularly in the area of mergers and acquisitions, and high technology engineering. He is the author of “Designing a Successful KM Strategy; a Guide for the Professional Knowledge Manager” (Information Today, in press), “The Lessons Learned handbook” (Woodhead publishing, 2010) and “Knowledge Management for Teams and Projects (Chandos Publishing, 2005), and co-author of “Knowledge Management for Sales and Marketing (Chandos Publishing, 2011) and “Performance through Learning – knowledge management in practice” (Elsevier, 2004). Prior to founding Knoco, Nick spent two years at the centre of the team that made BP the leading KM company in the world, acting as the team Knowledge Manager, developing and implementing BP’s knowledge of „how to manage knowledge”, and coordinating the BP KM Community of Practice. Nick blogs most days (www.nickmilton.com) and can be found on Twitter (@nickknoco). Director, Knoco ltd. Rose Cottage, Burnett, Keynsham, Bristol, UK BS31 2TE. +44 7803 592947. Email: This email address is being protected from spambots. You need JavaScript enabled to view it..
